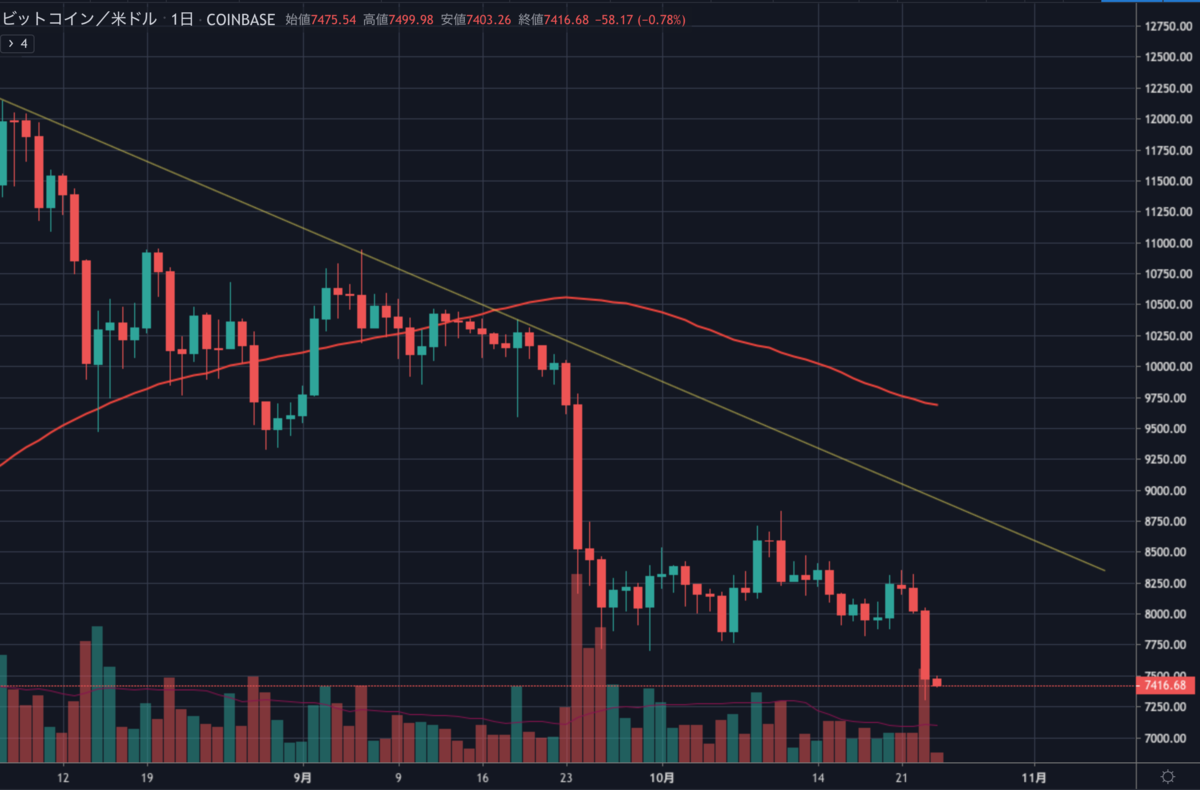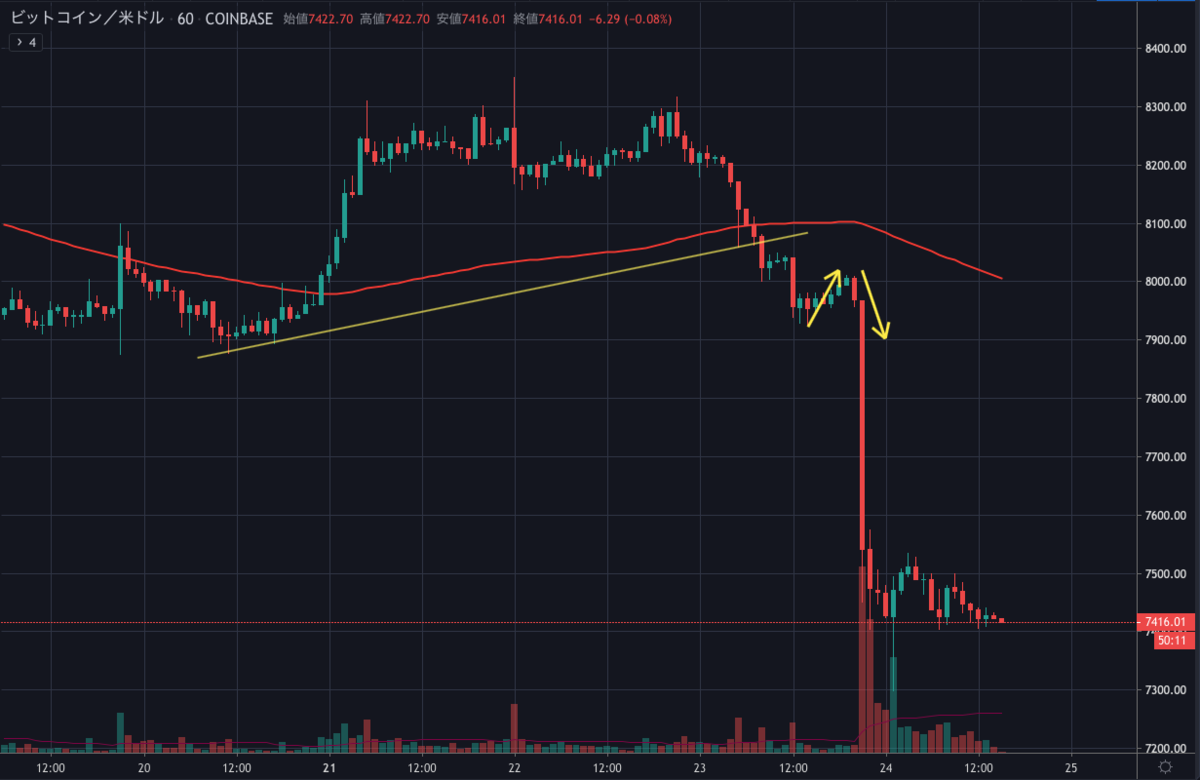
昨日はビットコインが急落し、半年ぶりに7,400ドルを割り込みました。
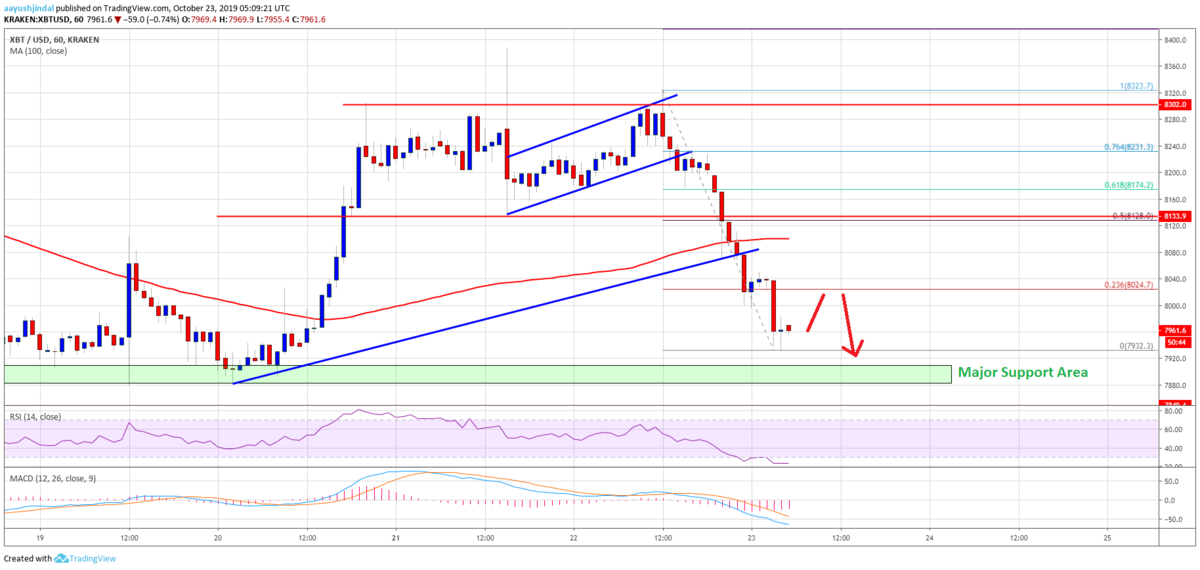
チャートを見ると、ここ数日間のレンジを下にブレイクしていることがわかります。

サポートラインで反発することもなく、大きく下落しました。

Bitcoin (BTC) Price Approaching Key Support, Bears Back In Action

今後の値動きはどのように予想されるのでしょうか。
NEWS BTCでビットコインのチャート分析を見てみます。
ビットコインのチャート分析
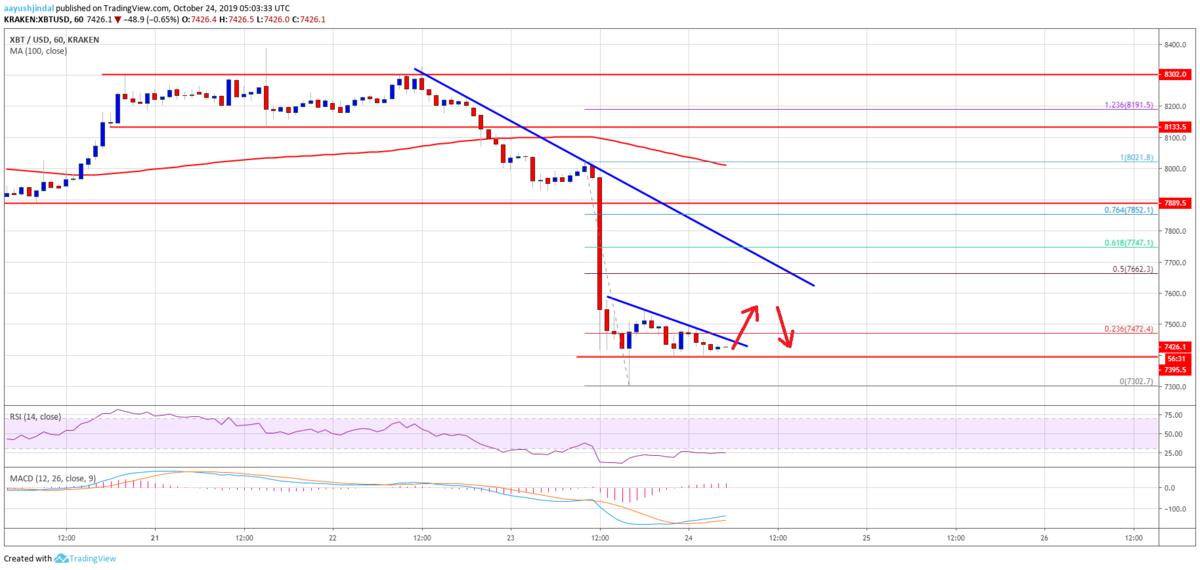
An immediate resistance is near the $7,440 level. Additionally, there are two connecting bearish trend lines forming with resistance near $7,450 and $7,660 on the hourly chart of the BTC/USD pair.
直近のレジスタンスは7,440ドル付近になります。さらに、BTC/USDペアの時間足チャートには、7,450ドルと7,660ドル付近でレジスタンスとなる下降トレンドライン(2本)が形成されています。

The second trend line coincides with the 50% Fib retracement level of the recent decline from the $8,021 high to $7,302 low. If there is an upside break above the $7,660 resistance, the price could recover towards the $7,800 and $7,880 resistance levels (the previous supports).
2つ目のトレンドラインは、最近の下落(8,021ドル〜7,302ドル)の50% Fibリトレースメントレベルと一致します。7,660ドルのレジスタンスを上抜けると、7,800ドルと7,880ドルのレジスタンス水準(以前のサポート)まで価格が回復する可能性があります。
On the downside, the $7,380 level is an immediate support. If there is a downside break below $7,380, the price could revisit the $7,300 support area. Any further losses are likely to call for a push towards the $7,200 and $7,120 levels.
下落する場合の直近のサポートは7,380ドル付近です。7,380ドルを下抜ける場合、価格は7,300ドルのサポートエリアに戻る可能性があります。さらに下落すると、7,200ドルと7,120ドル付近を目指すことになるでしょう。
via: Bitcoin (BTC) Price Won’t Go Quietly, Risk of Bounce Grows
_


