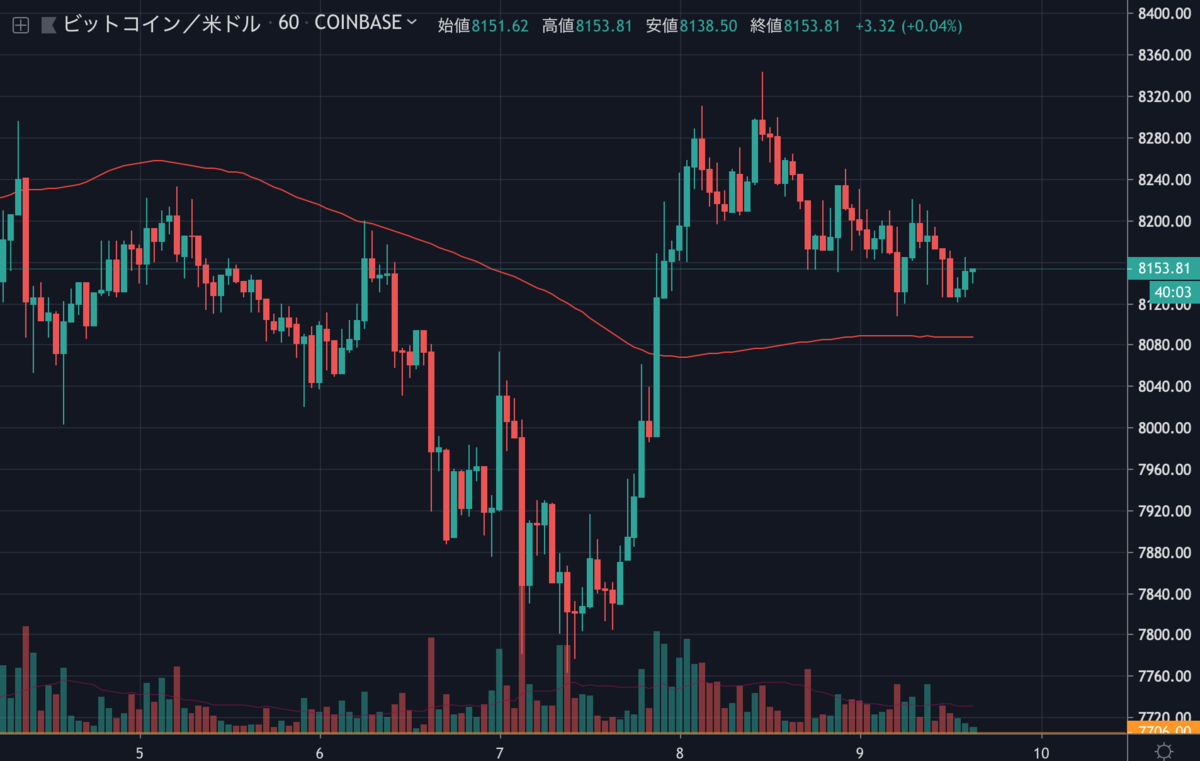
ビットコインは2日前に急騰したものの、昨日は少し価格を戻し、現在は8,150ドル付近で取引されています。

時間足チャートでは100時間SMA(単純移動平均線)の上側を推移しており、まだ反発する可能性もありそうです。
今後の値動きはどのように予想されるのでしょうか。
NEWS BTCでチャート分析を見てみます。
ビットコインのチャート分析
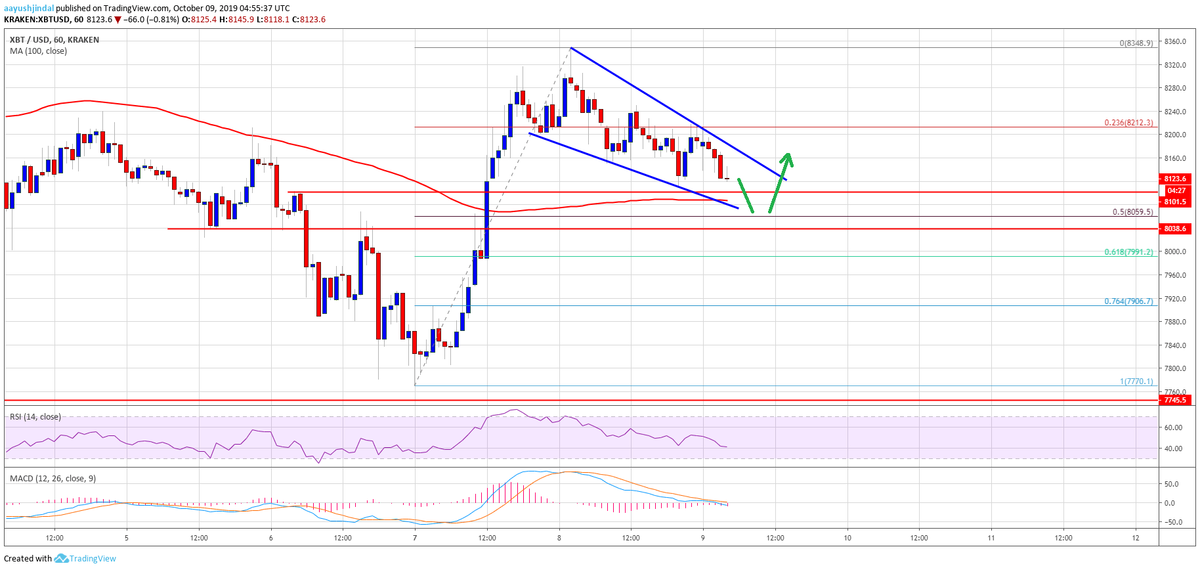
On the downside, there are a few key supports near the $8,100, $8,050 and $8,000 levels.
下落する場合、8,100ドル、8,050ドル、8,000ドル付近にいくつかの重要なサポートがあります。

Therefore, dips remain well supported on the downside near the $8,050 level. At the moment, there is a short term contracting triangle forming with resistance near $8,160 on the hourly chart of the BTC/USD pair. If bitcoin breaks the $8,160 resistance, there are chances of a fresh increase above the $8,200 and $8,300 levels. Finally, a clear break above $8,350 might push the price towards the key $8,500 resistance.
そのため、下落は8,050ドル付近のサポートでしっかりサポートされるでしょう。現在、BTC/USDペアの時間足チャートに、8,160ドル付近でレジスタンスとなる短期的な三角保ち合いが形成されています。ビットコインが8,160ドルのレジスタンスを突破すれば、8,200ドルと8,300ドル台を超えて新たに上昇を始める可能性があります。最後に、8,350ドルをはっきりと上抜けると、価格は8,500ドルの重要なレジスタンスに向けて上昇するかもしれません。
On the other hand, a downside break below $8,050 and the 100 hourly SMA might increase bearish pressure. The next key support is near $8,000 or the 61.8% Fib retracement level of the upward move from the $7,770 low to $8,348 high. Should there be a downside break below $8,000, the price could continue to move down.
逆に、8,050ドルと100時間SMAを下抜けると、弱気の圧力が強くなる可能性があります。次の重要なサポートは8,000ドルまたは7,770ドル〜8,348ドルの上昇の61.8% Fibリトレースメントレベル付近です。8,000ドルを下抜けるとさらに下落を続ける可能性があります。
via: Bitcoin Price (BTC) Holding $8K and Likely To Bounce Back
_


