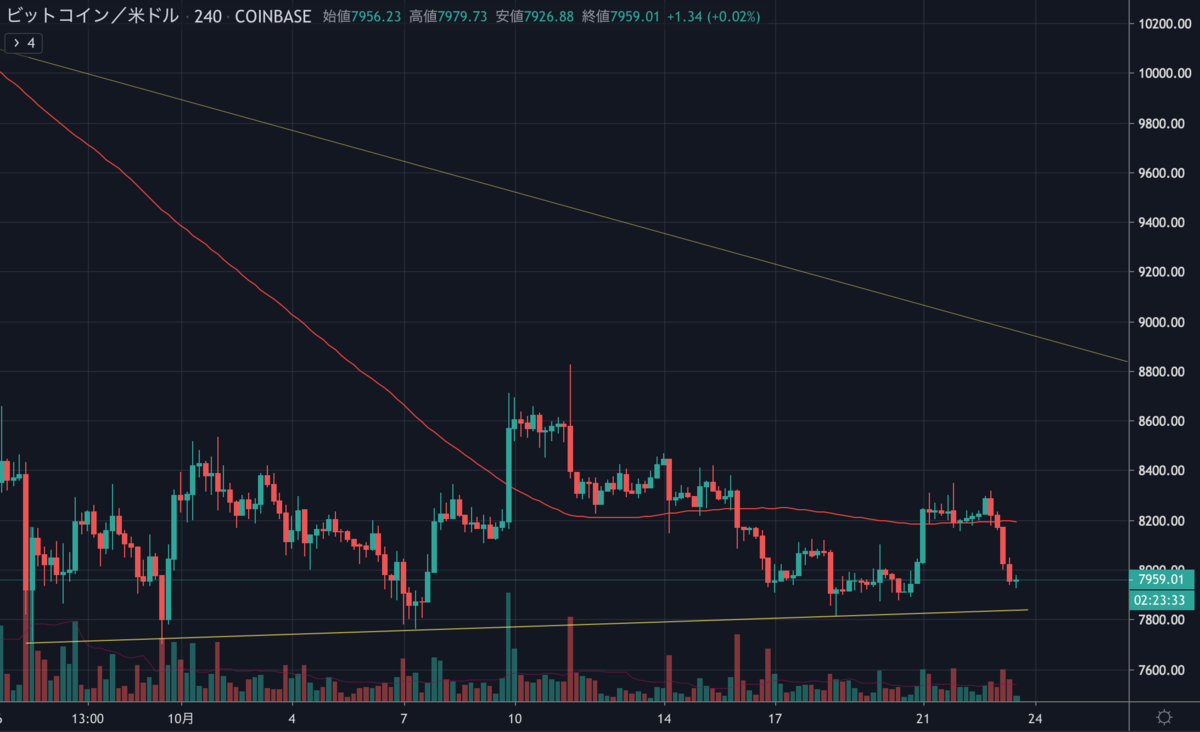
昨日のビットコインは8,300ドルを突破しようとしたものの、結局上昇は続かず、8,000ドルを割り込み急落しました。現在は7,900ドル付近で取引され、サポートライン(下値支持線)のある7,800ドルに向かっているようにも見えます。

このサポートラインを下抜けるとさらに下落を拡大しそうですが、今後の値動きはどのように予想されるのでしょうか。
NEWS BTCでビットコインのチャート分析を見てみます。
ビットコインのチャート分析
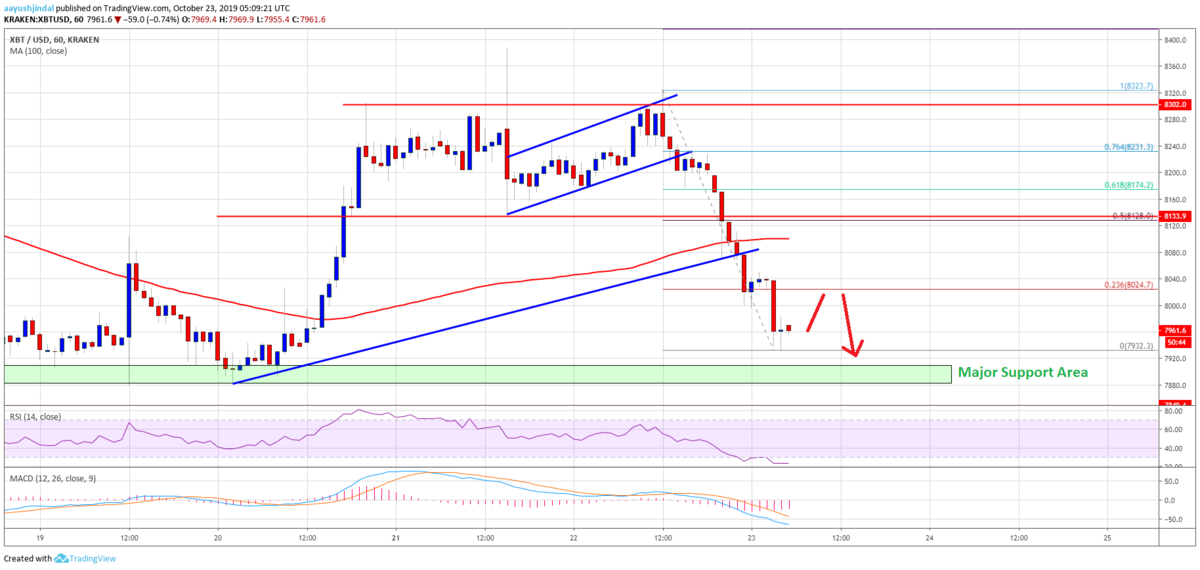
If there is an upside correction, an immediate resistance is near the $8,000 level. Additionally, the 23.6% Fib retracement level of the recent decline from the $8,323 high to $7,932 low is also near the $8,020 level to act as a resistance.
もし上方修正があれば、直近のレジスタンスは8,000ドル付近になります。さらに、最近の下落(8,323ドル〜7,932ドル)の23.6% Fibリトレースメントレベルも、8,020ドル付近でレジスタンスとして機能するでしょう。
If there is a decent recovery, the price could test the $8,100 resistance area (the previous support) and the 100 hourly SMA.
しっかりと回復する場合は、8,100ドルのレジスタンスエリア(以前のサポート)と100時間SMA(単純移動平均線)を試す可能性があります。

Looking at the chart, bitcoin is clearly struggling below $8,020 and $8,120. An immediate support is near the $7,800 area. If the bulls fail to defend the $7,800 support area, there is a risk of a breakdown. The next major support is near the $7,500 area, where the bulls may take a stand.
チャートを見ると、ビットコインは明らかに8,020ドルと8,120ドル以下で低迷しています。直近のサポートは7,800ドル付近です。買い方が7,800ドルのサポートエリアを守れなければ急落の恐れがあります。次の大きなサポートは7,500ドル付近、ここで買いが入る可能性があります。
via: Bitcoin (BTC) Price Approaching Key Support, Bears Back In Action
_


