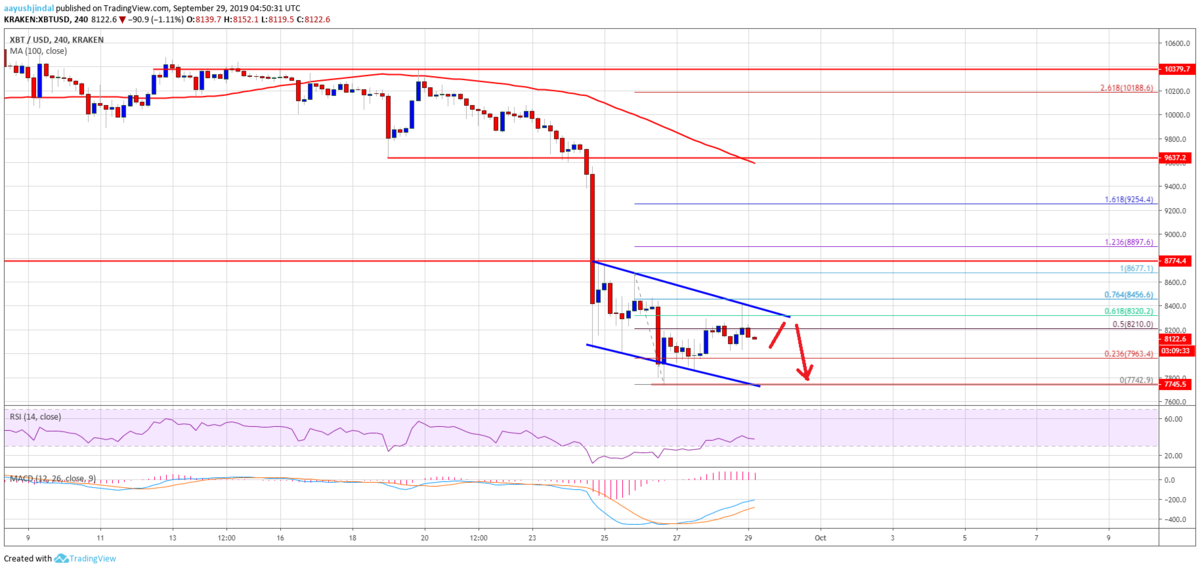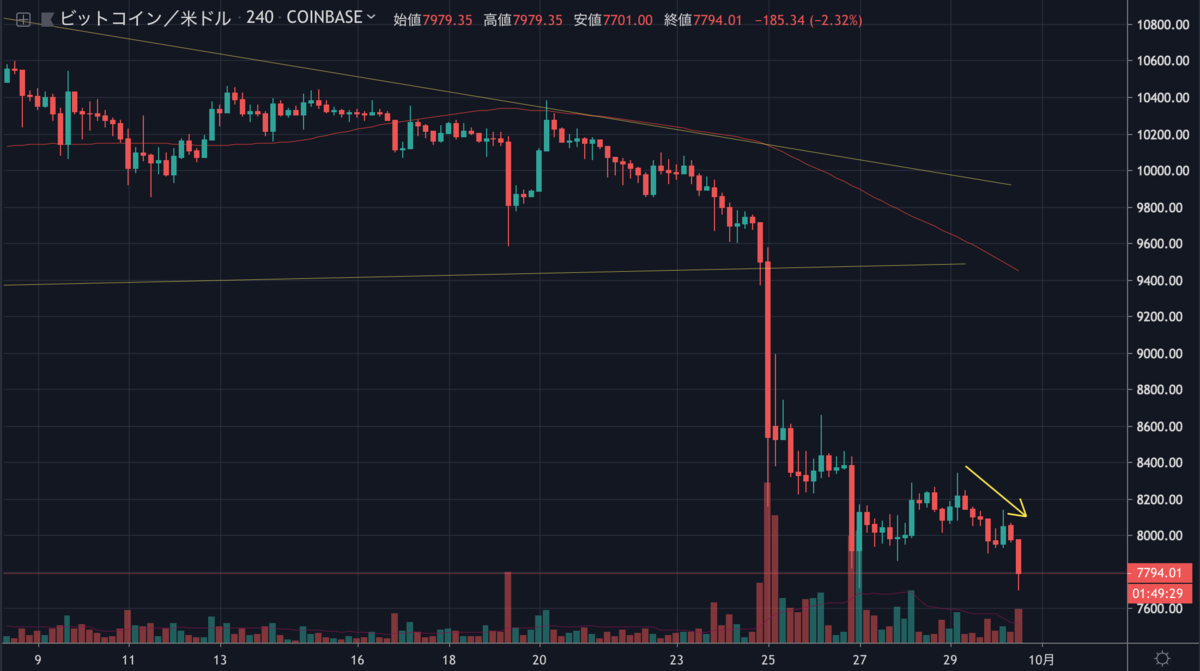
本日の13時頃からビットコインが再び下落を始めました。
個人的には先週の急落前からずっとショートポジションを持ち続けているのでいくら下落してくれても構わないのですが、ロングの方にはちょいと厳しい状況だと思います。(NEWS BTCを読んでいる人にはあまりいないかも?)

Bitcoin (BTC) Price Weekly Forecast: Downtrend Intact Below $9K

今後ビットコインが反発して上昇に転じる可能性はあるのでしょうか。
NEWS BTCのチャート分析を見てみます。
ビットコインのチャート分析
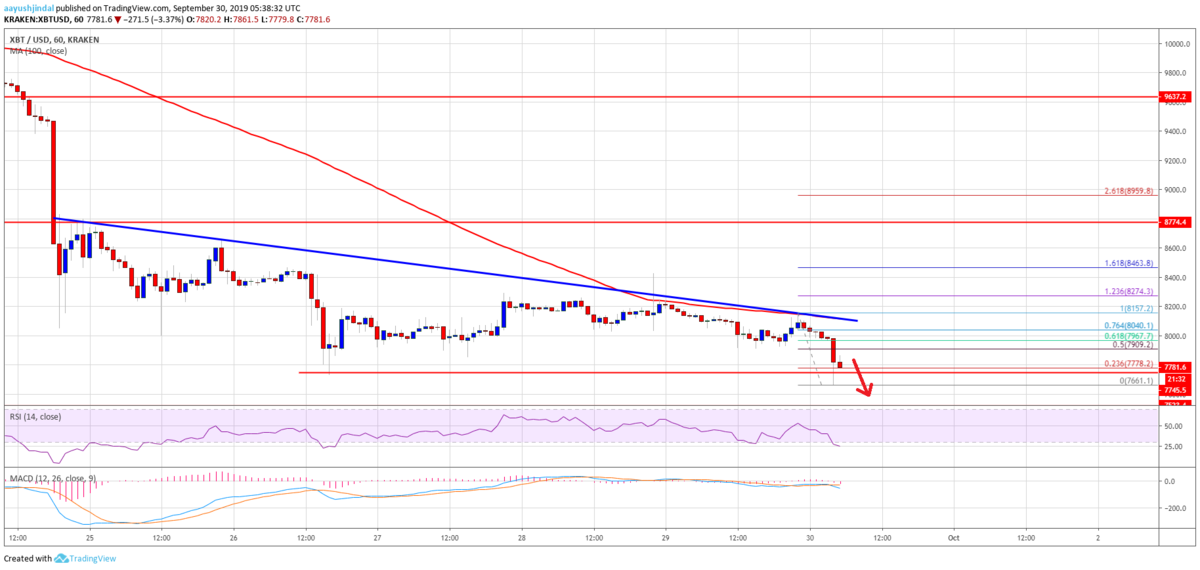
An intermediate resistance is near the $8,040 level, plus the 76.4% Fib retracement level of the recent decline from the $8,157 high to $7,661 low. Therefore, an upside break above the $8,000 and $8,100 levels is must for a decent recovery in bitcoin. The next key resistance is near the $8,400 level.
中間のレジスタンスは8,040ドル付近、さらに最近の下落(8,157ドル〜7,661ドル)の76.4% Fibリトレースメントレベルになります。そのため、ビットコインが堅実に回復するには、8,000ドルと8,100ドルレベルを上抜ける必要があります。次の重要なレジスタンスは8,400ドル付近です。

If the price fails to recover above the $8,000 and $8,100 resistance levels, it could continue to decline. An immediate support is near the $7,600 level, below which the price is likely to test the main weekly bearish target of $7,500. Moreover, if there are more downsides, the price may perhaps test the $7,200 support area.
価格が8,000ドルと8,100ドルのレジスタンスを上抜けることができなければ、下落が継続する可能性があります。直近のサポートは7,600ドル付近、これを下抜けると一週間のメインターゲットである7,500ドルを試す可能性が高いでしょう。また、さらに下落するとおそらく7,200ドルのサポートエリアを試す可能性もあります。
Looking at the chart, bitcoin is clearly declining and is struggling below the $8,000 level. Therefore, there is a risk of more downsides towards $7,500 and $7,200. Having said that, the bears need to be careful since there could be a strong bounce once the current wave is complete.
チャートを見ると、ビットコインは明らかに下落しており、8,000ドル以下で苦戦しています。そのため、7,500ドルと7,200ドルへ向けてさらに下落する恐れがあります。とは言え、現在の波が終わると強く反発する可能性があるので弱気派は注意が必要です。
via: Bitcoin Price (BTC) Staging Another Dip Before It Could Recover
_


