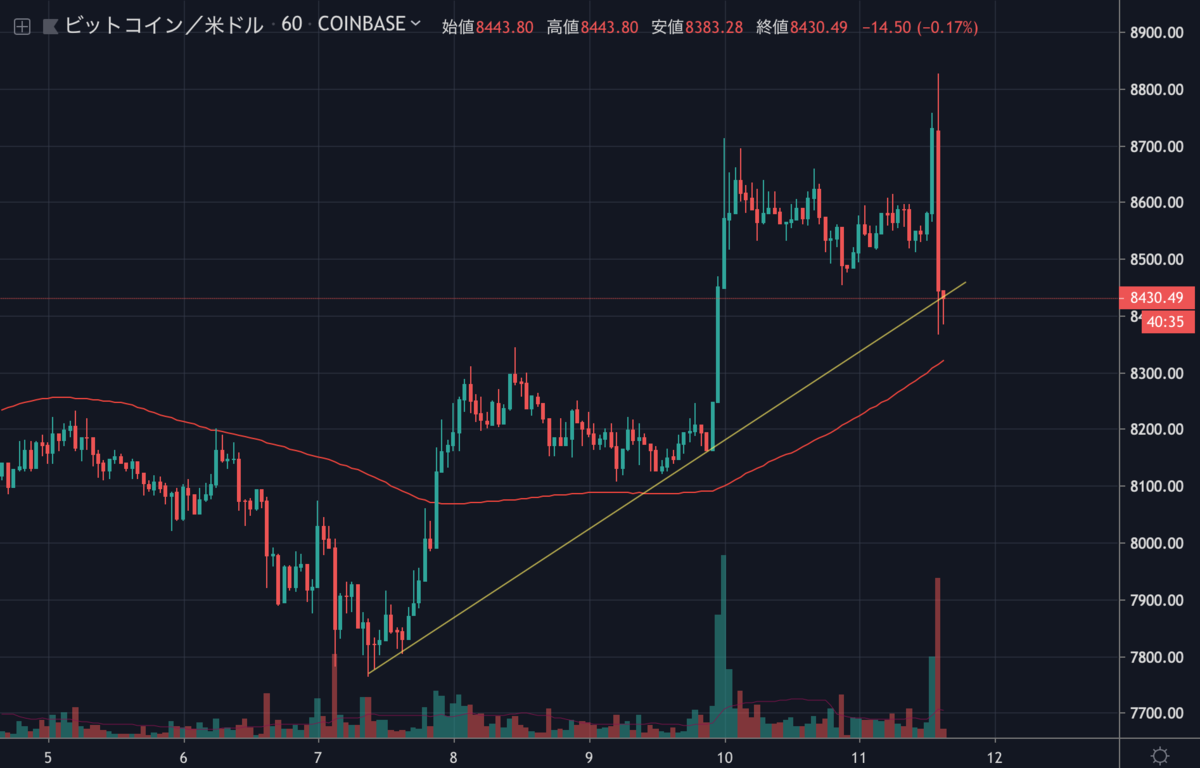
昨日のビットコインはほぼヨコヨコで推移していましたが、今日の午後13時台に急騰、その後100SMA付近まで急落しました。

BTCは今後も上昇を継続してくれるのでしょうか。
NEWS BTCのチャート分析を見てみます。
ビットコインのチャート分析
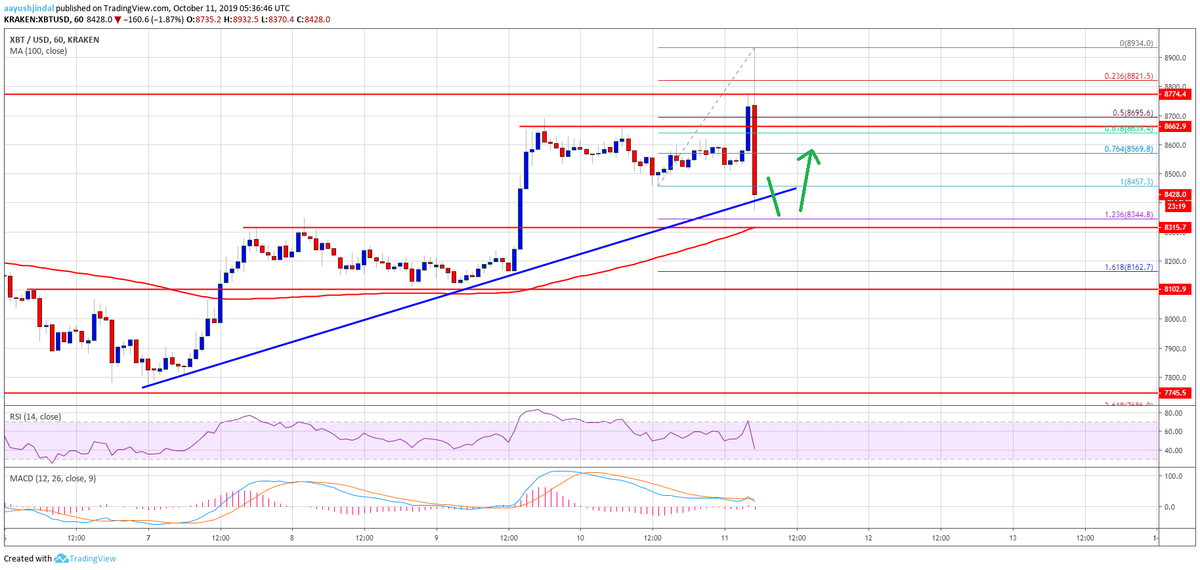
The next key support is near the $8,350 level (the previous resistance area). It represents the 1.236 Fib extension level of the recent rally from the $8,457 low to $8,934 high. The main support is near the $8,315 level since it coincides with the 100 hourly SMA. Therefore, a close below the $8,000 support might push the price back into a bearish zone.
次の重要なサポートは8,350ドル付近(以前のレジスタンスエリア)です。これは、最近の上昇(8,457ドル〜8,934ドル)の1.236 Fibエクステンションレベルを表します。100時間SMA(単純移動平均線)と一致していることから、メインサポートは8,315ドル付近になります。そのため、8,000ドル以下で引けると価格は弱気ゾーンに戻る可能性があります。

On the upside, an initial resistance is near the $8,550 level, followed by $8,600. The main resistances are near the $8,660 and $8,800 levels. It seems like the price might trade in a range above the $8,300 support area before it could start a fresh increase.
上昇時の直近のレジスタンスは8,550ドル付近、それに8,600ドルが続きます。メインレジスタンスは8,660ドルと8,800ドル付近です。新たな上昇を始める前に、8,300ドルのサポートエリア以上でレンジで取引されそうです。
Looking at the chart, bitcoin is showing a lot of bearish signs from the $8,934 swing high. It seems like it was rejected close to $9,000. It is currently approaching the $8,350 and $8,300 support levels, where the bulls are likely to take a stand.
チャートを見ると、ビットコインは高値の8,934ドルから多くの弱気サインを見せています。9,000ドル付近で反発したようですが、現在は8,350ドルと8,300ドルのサポートレベルに接近しており、強気派が買い始める可能性が高いでしょう。
via: Bitcoin (BTC) Price Dives $500 But Holding Key Support
_


