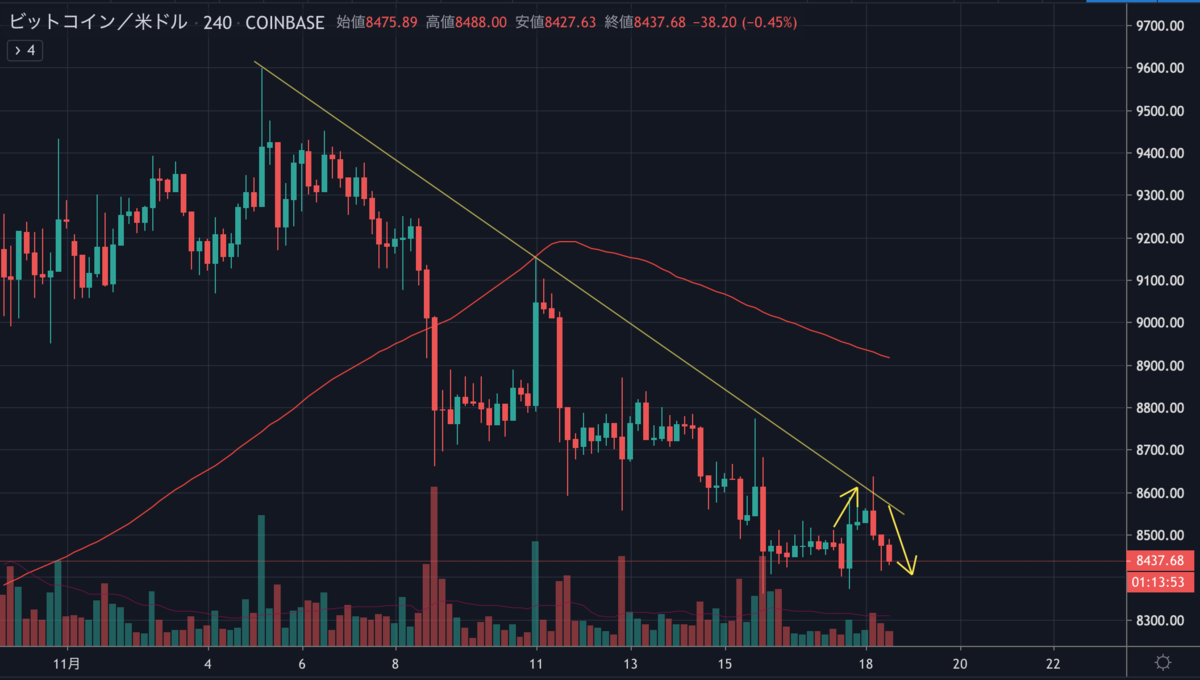
ビットコインは相変わらずの下落ムードで、現在は8,400ドル付近で取引されています。アメリカ株が史上最高値を更新するなど好調なため、仮想通貨市場へ資金が流れてこないのでしょうか。
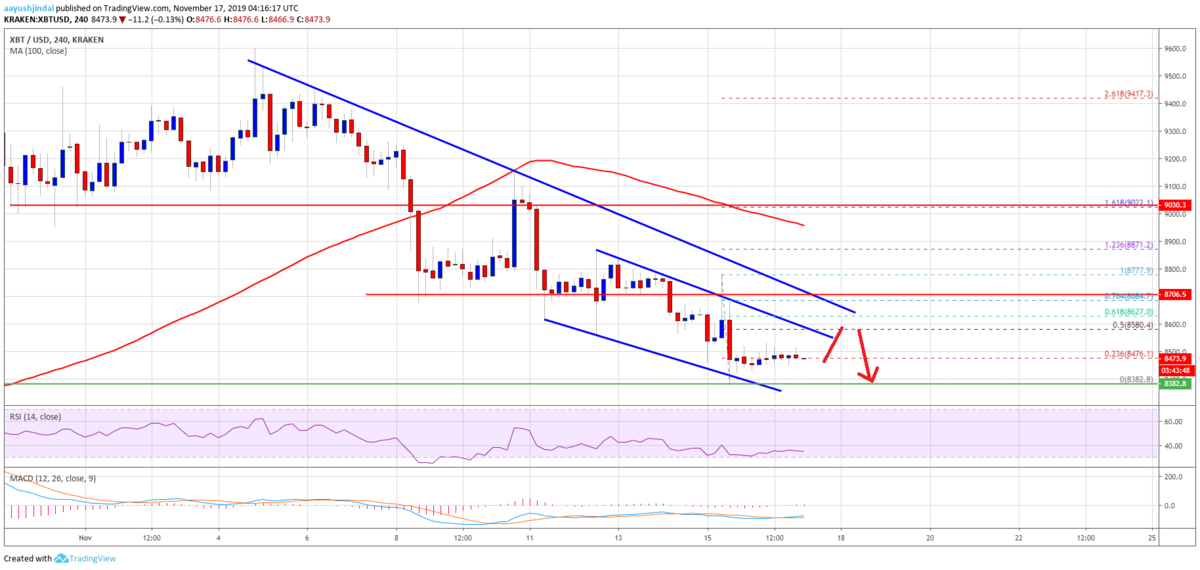
昨日のBTCはNEWS BTCの予想図に近い値動きでした。

Bitcoin Weekly Forecast: BTC Price Turned Sell On Rallies

このまま9,000ドル台へ回復することなく下落を続けるのでしょうか。
NEWS BTCでビットコインのチャート分析を見てみます。
ビットコインのチャート分析
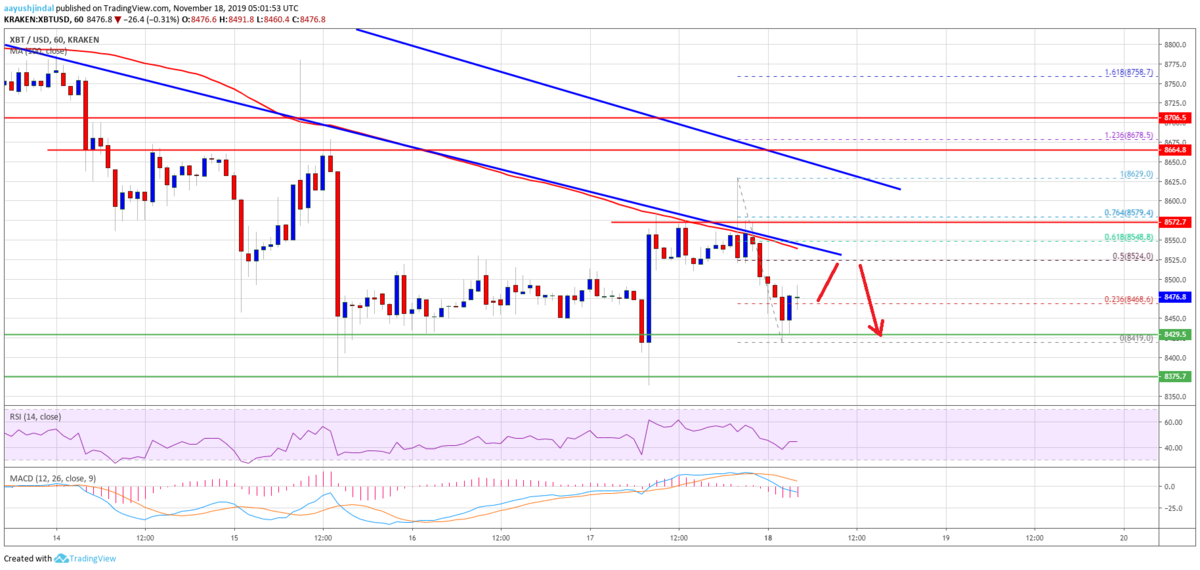
On the upside, there are many key resistances near the $8,600 area. An immediate resistance is near the $8,520 level since it coincides with the 50% 23.6% Fib retracement level of the latest drop from the $8,629 high to $8,419 low.
上昇する場合、8,600ドル付近に多くのレジスタンスがあります。直近のレジスタンスは8,520ドル付近で、これは最近の下落(8,629ドルの〜8,419ドル)の50% Fibリトレースメントレベルと一致します。

Additionally, the 100 hourly simple moving average is also near the $8,520 level. More importantly, there is a major bearish trend line forming with resistance near $8,525 on the hourly chart of the BTC/USD pair.
さらに、100時間SMA(単純移動平均線)も8,520ドル付近にあります。さらに重要なのは、BTC/USDペアの時間足チャートに、8,525ドル付近でレジスタンスとなる大きな下降トレンドラインが形成されていることです。
Above the trend line, bitcoin price is likely to face another strong resistance near the $8,600 area. The next key resistance is near the $8,660 level, above which the price could start a decent recovery.
このトレンドラインを上抜けると、ビットコインは8,600ドル付近で再び強いレジスタンスに直面する可能性が高いでしょう。次の重要なレジスタンスは8,660ドル付近で、これを上抜けると価格がかなりの回復を始める可能性があります。
Conversely, if the price fails to correct above $8,525 or $8,600, it might resume its decline. An initial support is near the $8,420 area. The next key support region is near the $8,375 level, below which the price is likely to test the $8,200 support area.
逆に、8,525ドルまたは8,600ドルを上抜けることができなければ、下落が再開する可能性があります。最初のサポートは8,420ドル付近で、次の重要なサポートは8,375ドルの付近です。これを下抜けると8,200ドルのサポートエリアを試すことになるでしょう。
via: Bitcoin (BTC) Relatively Muted; Support Estimated Near $8.2K
_


