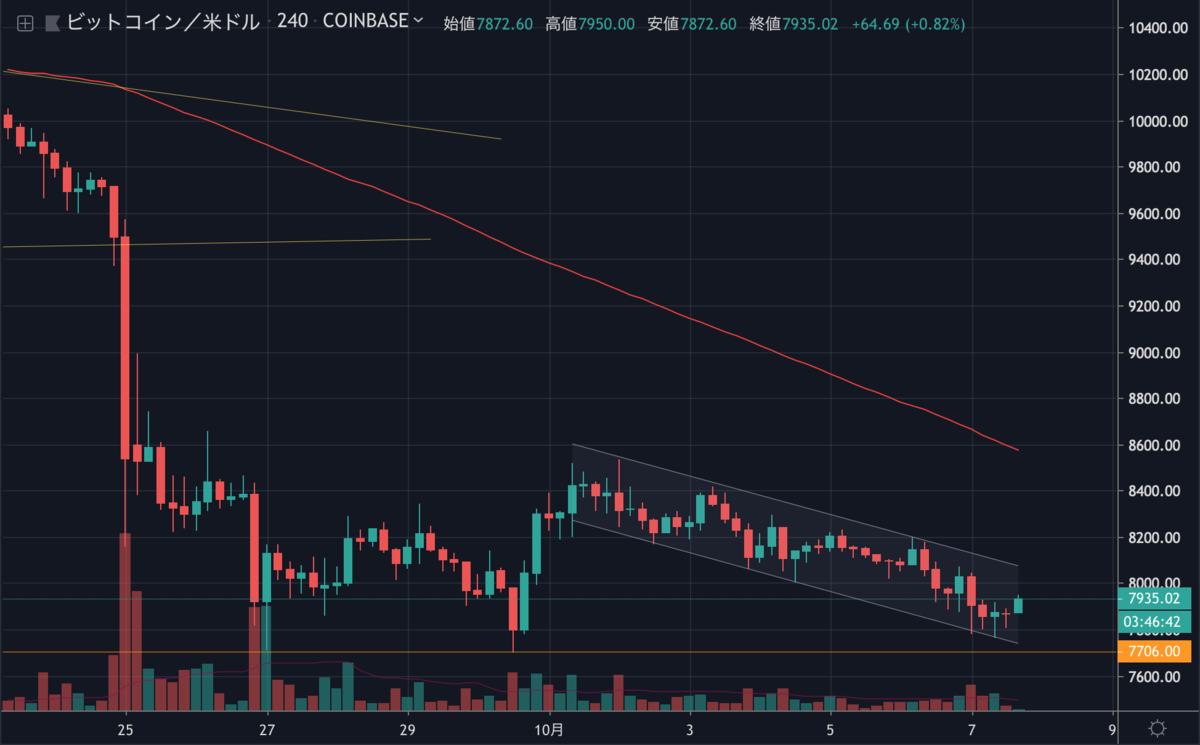
ここ数日間ビットコインはじわじわと下落を続けており、現在は8,000ドルを割り込み、先月の安値7,700ドルに迫っています。

一方でリップル(XRP)は急騰しており、ビットコインの資金がXRPに流れているのかもしれません。
ビットコインはこのまま下落を続けるのでしょうか。
NEWS BTCでビットコインのチャート分析を見てみます。
ビットコインのチャート分析
On the upside, there are many important hurdles forming for bitcoin near the $8,000 and $8,050 levels. Besides, there is a crucial declining channel forming with resistance near the $8,050 level on the hourly chart of the BTC/USD pair.
上昇する場合は8,000ドルと8,050ドル付近に多くの重要なハードルがあります。また、BTC/USDペアの時間足チャートに、8,050ドル付近でレジスタンスとなる重要な下降チャネルが形成されています。

On the downside, an immediate support is near the $7,770 low. If there is a downside break below $7,770 and $7,750, the price could accelerate losses. Besides. the main target for the bears could be $7,500 (as discussed in the past few analyses).
下落時の直近のサポートは安値の7,770ドル付近になります。7,770ドルと7,750ドルを下抜けると、さらに下落が加速する可能性があります。また、売り方のメインターゲットは7,500ドルになるでしょう。
Looking at the chart, bitcoin is currently trading in a downtrend below the $8,000 level and the 100 hourly SMA. Therefore, it seems like the price could extend its decline below the $7,750 and $7,650 levels. On the upside, the bulls are likely to face sellers near $8,000 or $8,050.
チャートを見ると、現在ビットコインは8,000ドルと100時間SMA以下で下降トレンドに沿って取引されています。そのため、7,750ドルと7,650ドルレベル以下まで下落を拡大する可能性があります。上昇する場合、8,000ドルまたは8,050ドル付近で売りが入る可能性が高でしょう。
via: Bitcoin Price (BTC) Extending Decline Below Key Support
_


