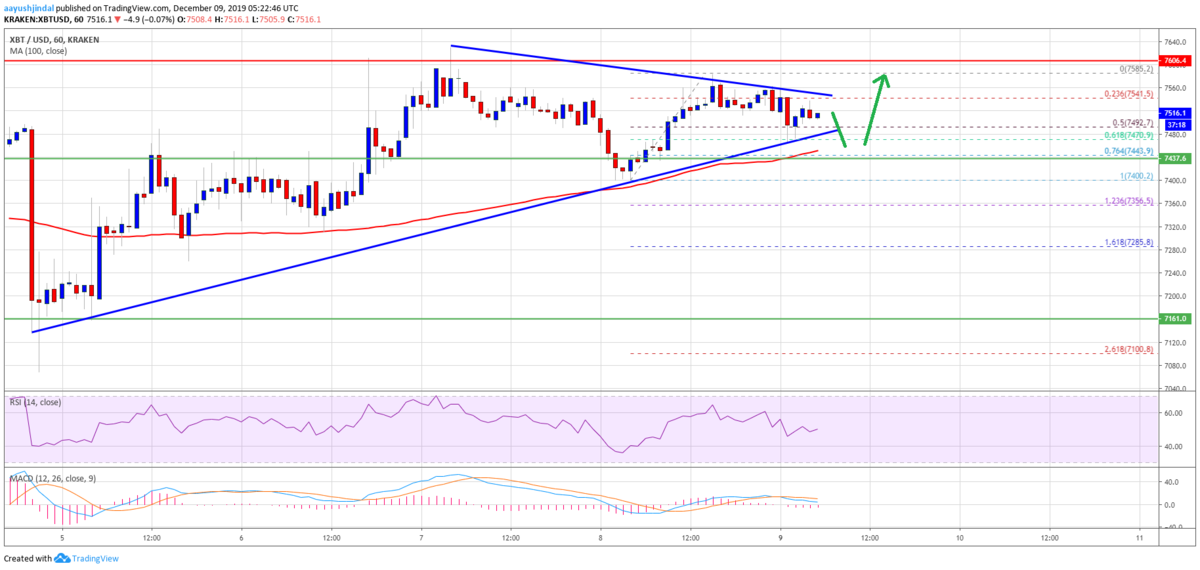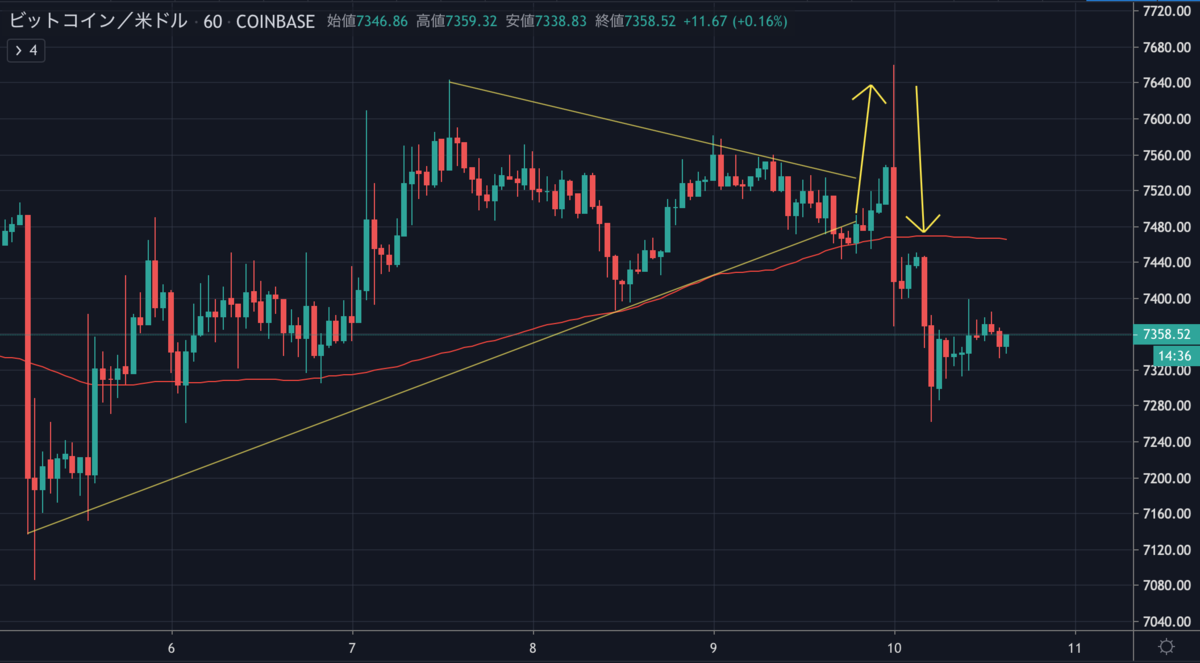
昨日のビットコインは一瞬急騰したものの、その後すぐに下落、そのまま現在も下げ続けています。
NEWS BTCの昨日の予想図は一瞬だけ的中していました。

Bitcoin (BTC) Target Fresh Monthly High or Even $8K

騙し上げからの急落で、三角保ち合いを下にブレイクした格好のBTCですが、今後の値動きはどのように予想されるのでしょうか。
NEWS BTCでビットコインのチャート分析を見てみます。
ビットコインのチャート分析
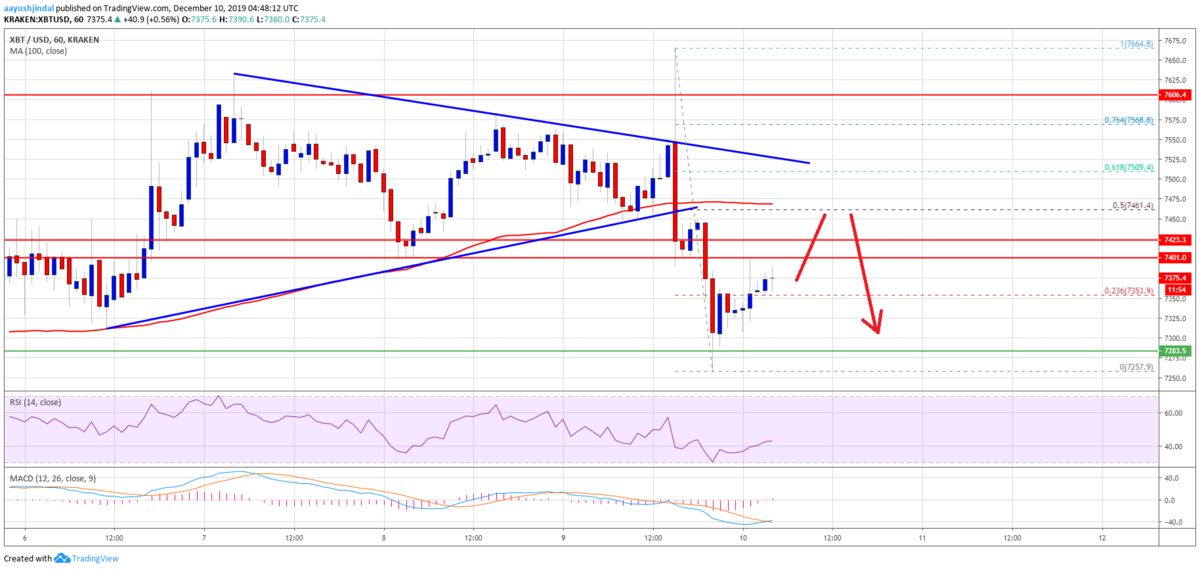
On the upside, there are a few important resistances near $7,400 and $7,420 (the previous support levels). The next key resistance is near the $7,460 level and the 100 hourly SMA.
上昇する場合は、7,400ドルと7,420ドル付近(以前のサポートレベル)にいくつかの重要なレジスタンスがあります。次に重要なレジスタンスは、7,460ドルと100時間SMA(単純移動平均線)付近になります。

Additionally, the 50% Fib retracement level of the recent decline from the $7,664 high to $7,257 low is near the $7,460 level to act as a resistance. There is also a key bearish trend line forming with resistance near $7,525 on the same chart.
また、最近の下落(7,664ドル〜7,257ドル)の50% Fibリトレースメントレベルが、7,460ドル付近でレジスタンスとして機能しています。さらに、同チャートには、7,525ドル付近でレジスタンスとなる下降トレンドラインが形成されています。
Therefore, an upward move towards the $7,460 and $7,500 levels may perhaps face a strong resistance. If there is an upside break above $7,500, the price could revisit $7,460 or $7,700.
そのため、7,460ドルと7,500ドルへ向けて上昇すると、おそらく強いレジスタンスに直面するでしょう。7,500ドルを突破すれば、再び7,460ドルまたは7,700ドルまで回復する可能性があります。
Looking at the chart, bitcoin price is back in a short-term bearish zone below $7,420. If it recovers and settles above $7,420, it may perhaps attempt to surpass $7,500. On the downside, the $7,280 and $7,250 levels hold the key in the near term.
チャートを見ると、ビットコインの価格は短期的に7,420ドル以下の弱気ゾーンに戻っています。もし7,420ドル以上に回復して安定すれば、7,500ドルを突破するかもしれません。下落する場合は、短期的に7,280ドルと7,250ドルの水準が重要になります。
via: Bitcoin (BTC) Turns Short Term Bearish But Holding Key Support
_


