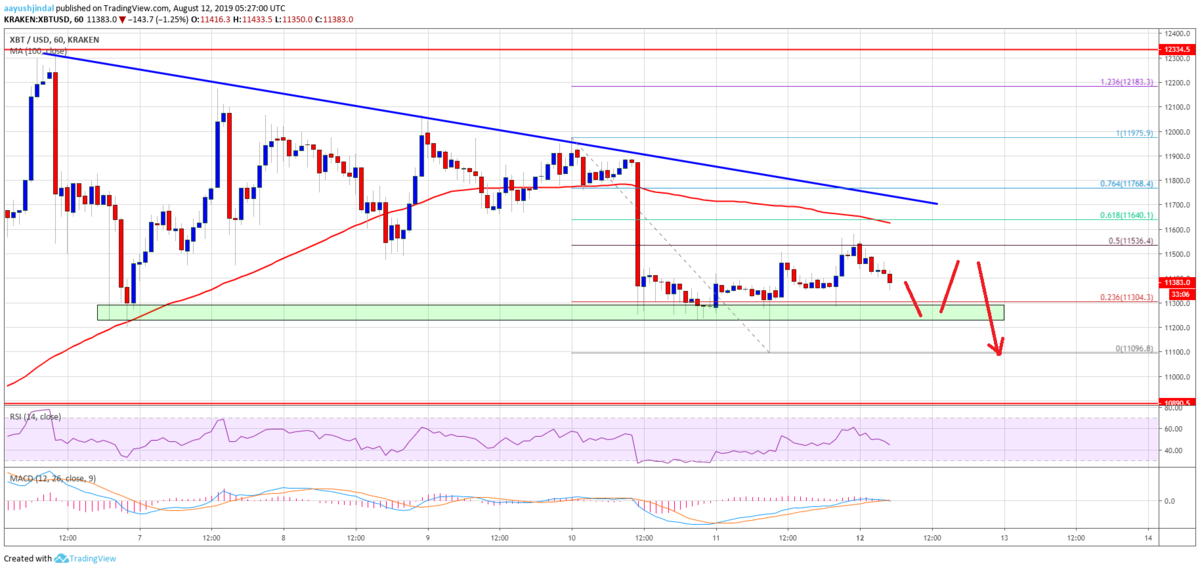
三角保ち合いを下抜け11,200ドル以下まで急落したビットコインは、これまで支持線として意識されていた11,500ドル付近の価格帯が抵抗線に転換し、上昇を妨げているようです。
上昇トレンドはもう終わってしまったのでしょうか。NEWS BTCのチャート分析を見てみます。
ビットコインのチャート分析
On the upside, there are a few important hurdles forming near $11,600 and $11,700. More importantly, there is a major bearish trend line forming with resistance near $11,700 on the hourly chart of the BTC/USD pair. Below the trend line, the 100 hourly SMA is near the 61.8% Fib retracement level of the downward move from the $11,975 high to $11,096 low.
上昇する場合は、11,600ドルと11,700ドル付近にいくつかの重要なハードルがあります。さらに重要なのは、BTC/USDペアの時間足チャートに、11,700ドル付近でレジスタンスとなる強い下降トレンドラインが形成されていることです。トレンドラインの下側には、100時間SMA(単純移動平均線)が、11,975ドル〜11,096ドルの61.8% Fibリトレースメントレベル付近にあります。

Therefore, the price is likely to face a strong selling interest near between the $11,600 and $11,700 levels. The main resistance is near the $11,800 level, above which the price could turn positive in the near term.
そのため、11,600ドルから11,700ドル周辺で強い売りが入る可能性が高いでしょう。主なレジスタンスは11,800ドル付近。これを上回れば近いうちに上昇に転じる可能性があります。
On the downside, an immediate support is near the $11,300 level. However, the main support is near the $11,200 level, below which the price might slide sharply below $11,000.
下落する場合は、直近のサポートが11,300ドル付近にあります。しかし、主なサポートは11,200ドル付近。これを下回ると11,000ドルを下抜け急落する可能性があります。
Looking at the chart, bitcoin price is trading in a bearish zone below the $11,600 and $11,700 resistance levels. Therefore, there is a risk of more downsides below the $11,200 and $11,000 supports.
チャートを見ると、ビットコインの価格は11,600ドルと11,700ドルのサポート以下の弱気ゾーンで取引されています。そのため、さらに下落して11,200ドルと11,000ドルのサポートを下抜ける恐れがあります。
via: Bitcoin (BTC) Price At Risk Of More Downsides Below $11,200
_


