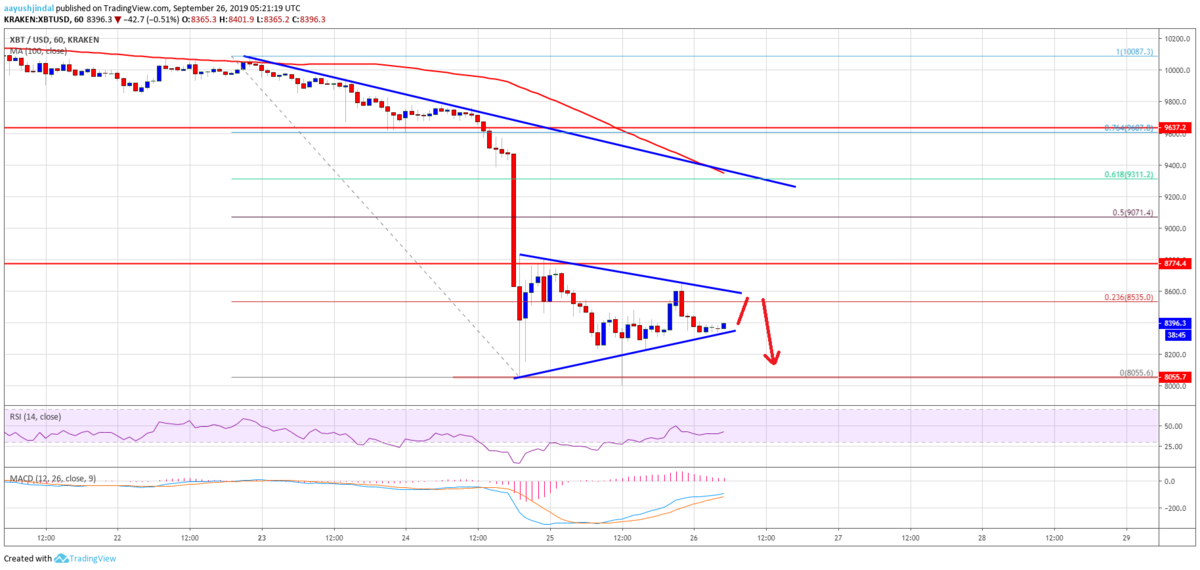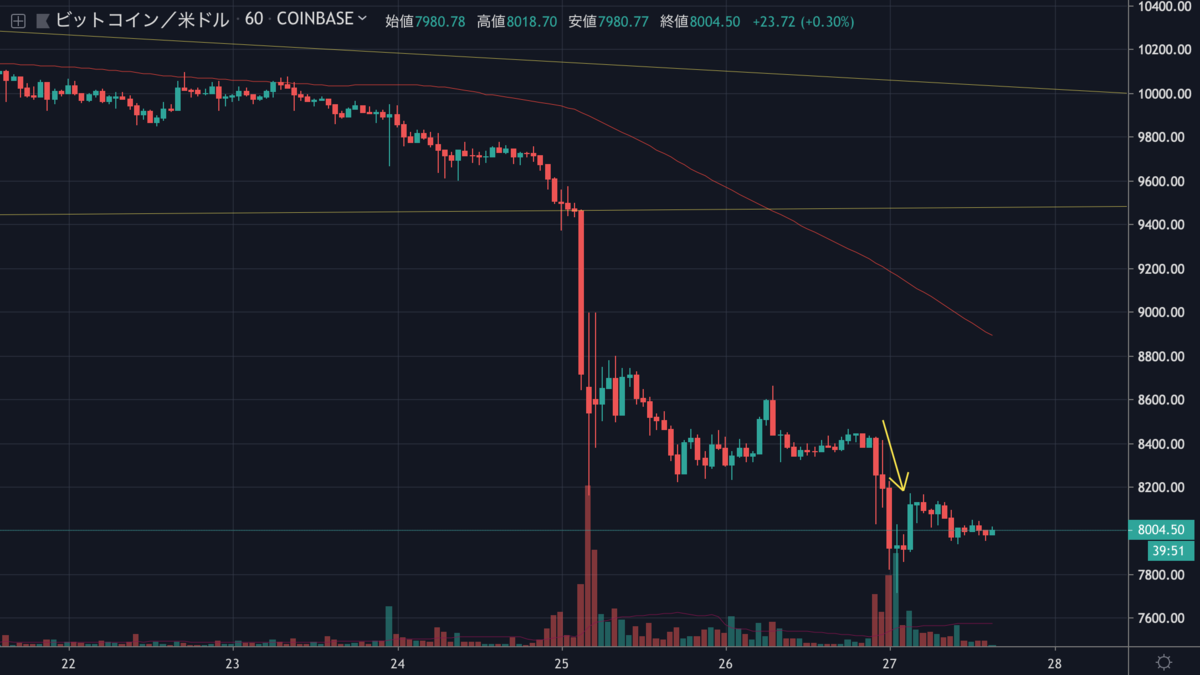
8,400ドル付近で推移していたビットコインは昨夜さらに下落、約7,700ドルの安値を付けました。

Bitcoin Price (BTC) Sighting Next Downside Break Below $8.2K

現在は8,000ドル付近まで戻していますが、今後もさらに下落する可能性がありそうです。
今後の値動きはどのように予想されるのでしょうか。
NEWS BTCのチャート分析を見てみます。
ビットコインのチャート分析
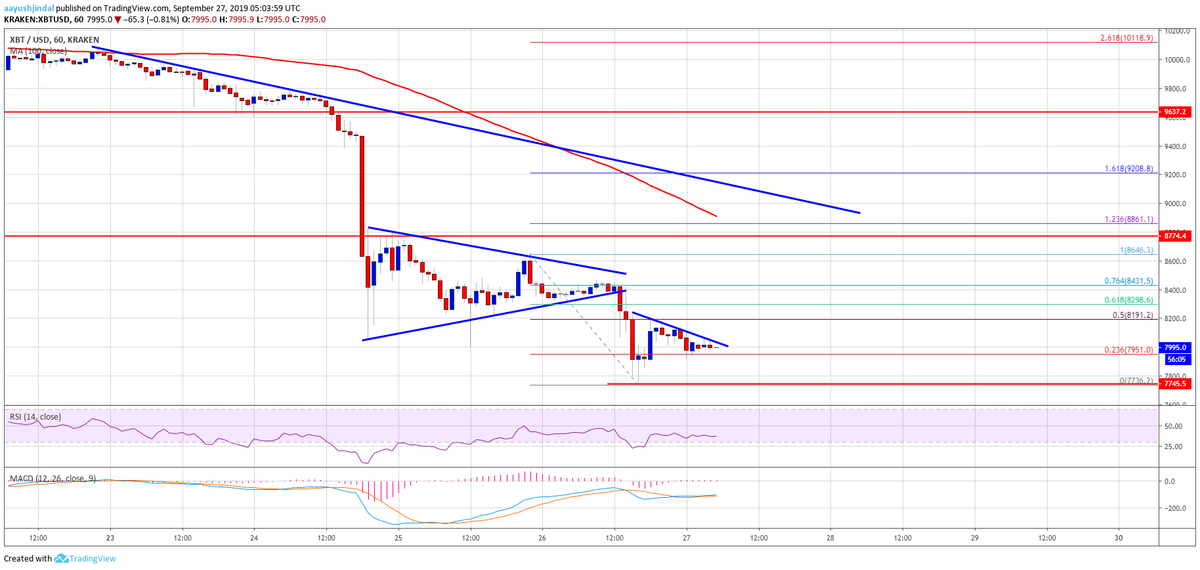
If the price fails to correct above $8,200, it could continue to move down. An immediate support is near the $7,800 level. Any further losses is likely to open the doors for a sharp decline towards the $7,500 support area in the near term. If the bulls fail to protect $7,500, the price could tumble towards the $7,000 support.
価格が8,200ドル以上まで戻らなければ、下落を継続する可能性があります。直近のサポートは7,800ドル付近。さらに下落すれば、近いうちに7,500ドルのサポートに向けて急落する可能性が生じるでしょう。7,500ドルが維持できなければ、7,000ドルのサポートに向かって下落する可能性があります。

Looking at the chart, bitcoin is clearly under pressure below $8,200 and $8,350. Therefore, there are high possibilities of more downsides towards $7,500 or even $7,200. Once the current decline is over, the price might correct above $8,500 in the coming days.
チャートを見ると、ビットコインは明らかに8,200ドルと8,350ドル以下で圧力をかけられています。そのため、7,500ドルか7,200ドルまで下落する可能性が高いでしょう。現在の下落が終われば、数日中に8,500ドル以上まで回復する可能性があります。
via: Bitcoin Price (BTC) Weekly Target of $7.5K Still In Sight
_


