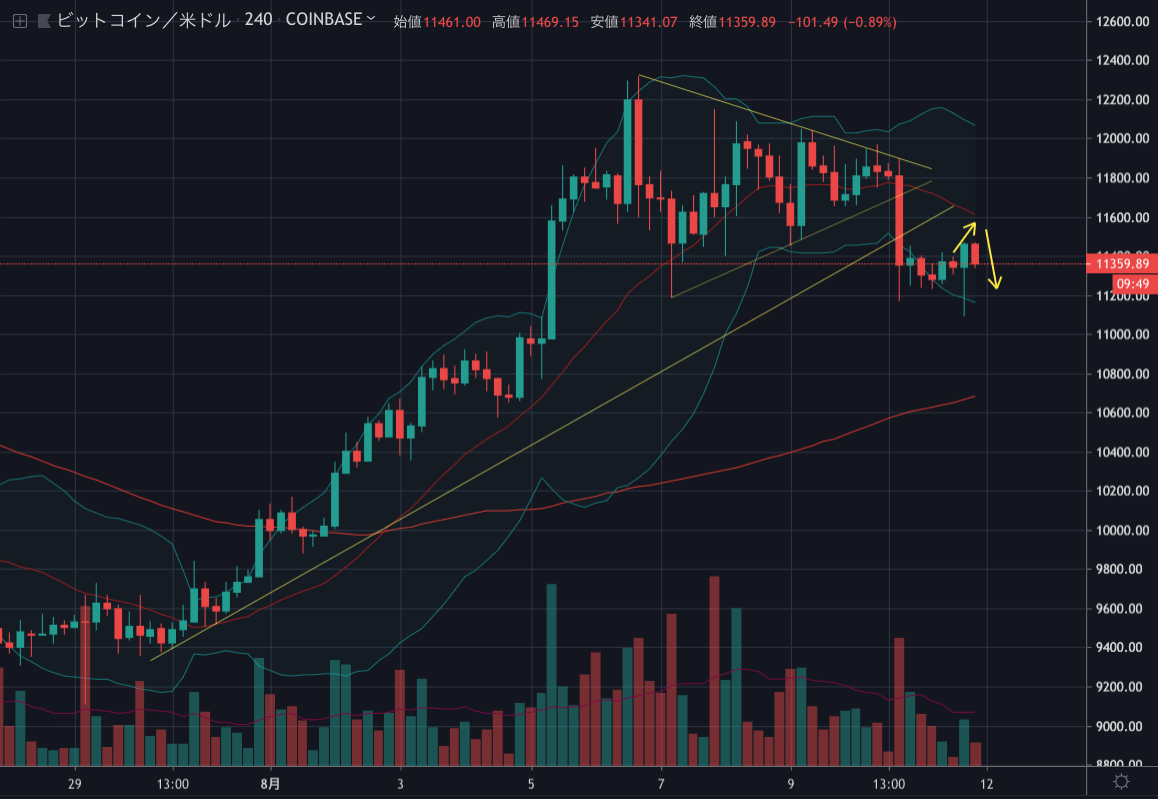
昨日のビットコインは三角保ち合いを下抜け、11,200ドル付近まで急落しました。
今後もさらに下落する可能性があるため、まだ利確や損切りをしていない方は注意してください。
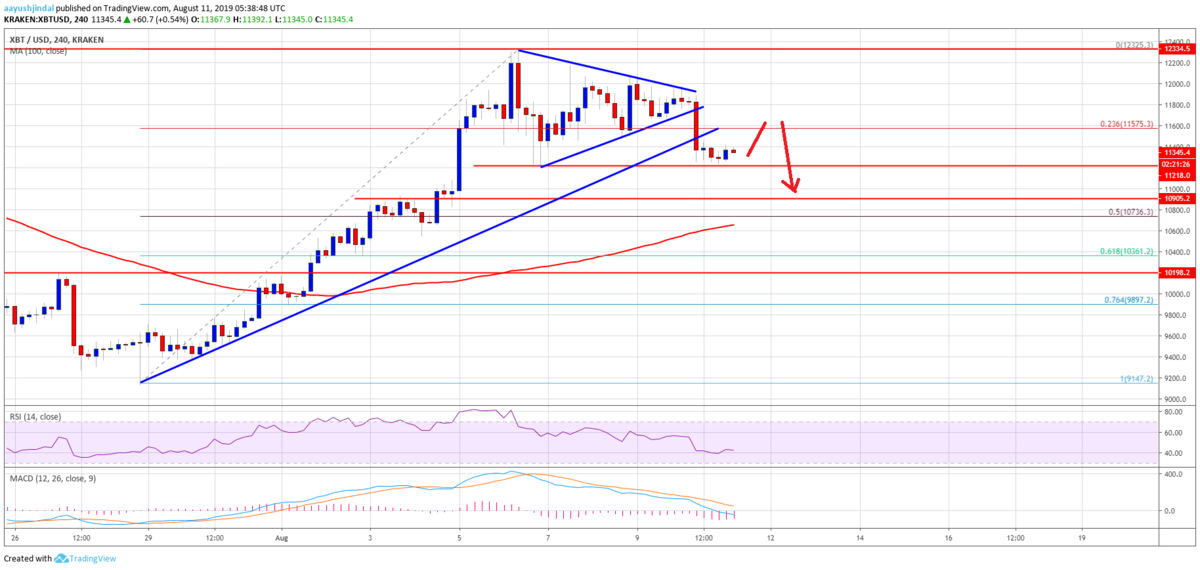
NEWS BTCのチャート分析を見てみます。
[8/12 0:50 追記]
今のところ予想図に近い値動き。さてどうなる?

ビットコインのチャート分析
If there are more downsides, the price could test the $11,000 or $10,900 support level. The next key support is near the $10,740 level. It represents the 50% Fib retracement level of the last upward move from the $9,147 low to $12,325 high.
さらに下落する場合は、価格は11,000ドルまたは10,900ドルのサポートを試すでしょう。次の重要なサポートは10,740ドル付近。これは前回の上昇(9,147ドル〜12,325ドル)の50% Fibリトレースメントレベルになります。

However, the main support is near the $10,500 level and the 100 simple moving average (4-hours). The final stop for the bears could be the $10,350 level. It coincides with the 61.8% Fib retracement level of the last upward move from the $9,147 low to $12,325 high. On the upside, an immediate resistance is near the $11,500 level.
しかし、主なサポートは10,500ドル付近と100期間単純移動平均線(4時間足)付近にあります。最終的には10,350ドル付近まで下落する可能性があります。これは、前回の上昇(9,147ドル〜12,325ドル)の61.8% Fibリトレースメントレベルと一致します。上昇する場合は11,500ドル付近が直近のレジスタンスになります。
Looking at the chart, bitcoin price is clearly correcting gains from the $12,325 high. It might continue to slide towards the $10,500 or $10,400 support. On the other hand, a successful break above $11,500 and a follow through above $11,800 is needed for more gains in the near term.
チャートを見ると、ビットコインの価格は明らかに高値の12,325ドルから利益を戻しています。ここからさらに10,500ドル、または10,400ドルのサポートまで下落を続ける可能性があります。一方、今後上昇するには、11,500ドルを上抜け、11,800ドル以上まで上昇する必要があります。
via: Bitcoin (BTC) Price Weekly Forecast: Risk Of Fresh Drop To $10,500
_


