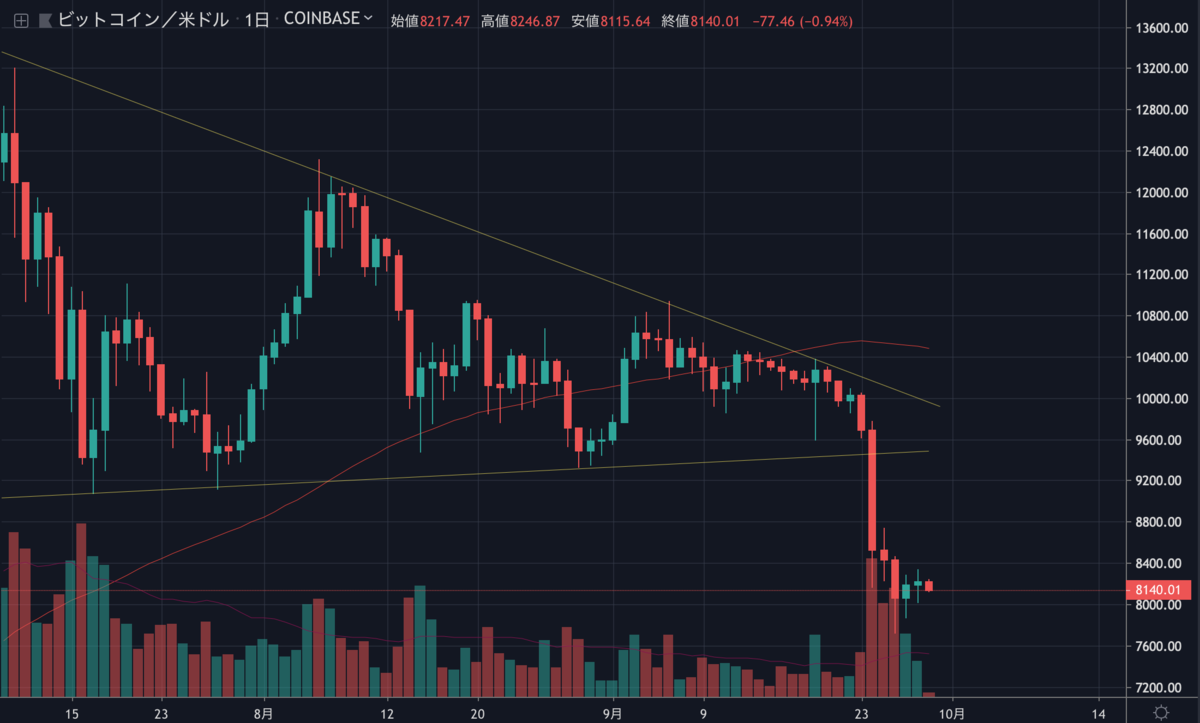
先週のビットコインは、しばらく継続していた三角保ち合いを下抜けする急落により、一時は8,000ドルを割り込みました。

その後は反発して8,000ドル台まで回復したものの、上昇トレンドに転じるほどの値動きはまだありません。
今後のBTCはどのように予想されるのでしょうか。
NEWS BTCのチャート分析(週間予想)を見てみます。
ビットコインのチャート分析
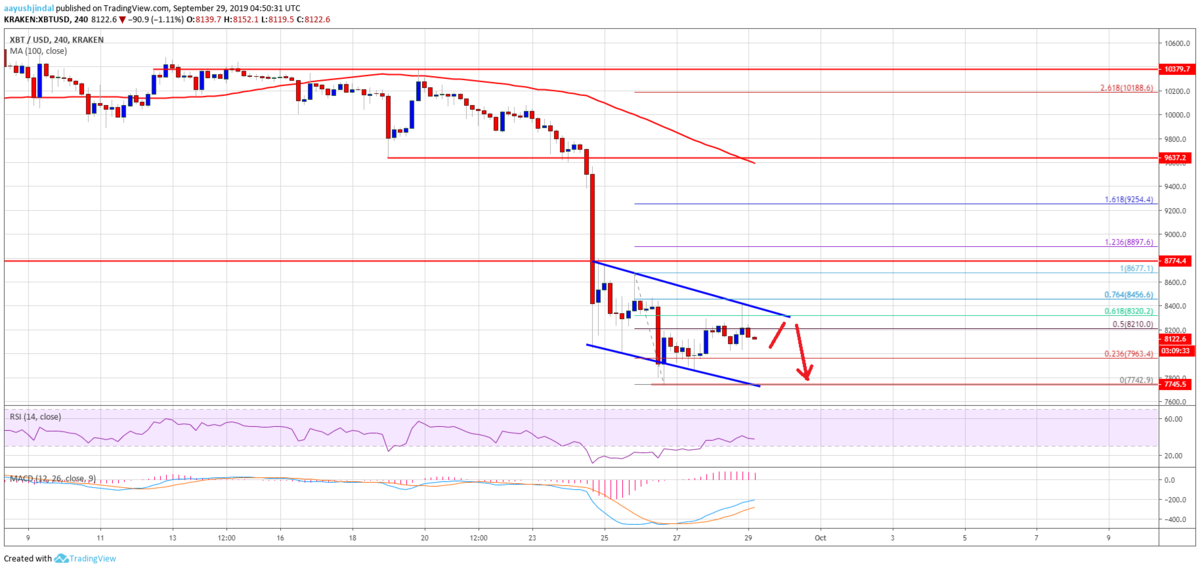
If there is an upside break above $8,350 and $8,450, the price could recover further. The main resistance on the upside is near the $8,750 level. A successful close above $8,750 and a follow through above $9,000 is needed for a strong recovery in bitcoin in the near term.
8,350ドルと8,450ドルを上抜けると、価格はさらに回復する可能性があります。上昇時の主なレジスタンスは8,750ドル付近です。短期的にビットコインが強く回復するには、8,750ドル以上で引けて9,000ドルを突破する必要があります。

On the downside, an initial support is near the $7,900 and $7,850 levels. If there is a downside break below the $7,850 support, the price could break the last swing low and continue lower. The main target for the bears could be $7,500. If there are more downsides, the price may perhaps test the $7,200 level.
下落時の最初のサポートは7,900ドルと7,850ドル付近になります。7,850ドルのサポートを下抜けるブレイクがあれば、価格は前回の安値を割り込みさらに下落を続ける可能性があります。売り方のメインターゲットは7,500ドルです。さらに下落すれば7,200ドル台を試すでしょう。
Looking at the chart, bitcoin price is clearly trading in a bearish zone below the $8,750 and $9,000 resistance levels. It seems like there are chances of more downsides below $7,850 and $7,750. Once the current wave is complete near $7,500 or $7,200, the price could start a strong recovery.
チャートを見ると、ビットコインの価格は明らかに8,750ドルと9,000ドルのレジスタンスを下回り弱気ゾーンで取引されています。7,850ドルや7,750ドル以下まで下落する可能性もありそうです。現在の波が7,500ドルや7,200ドル付近で終われば、力強い回復を始める可能性があります。
via: Bitcoin (BTC) Price Weekly Forecast: Downtrend Intact Below $9K
_


