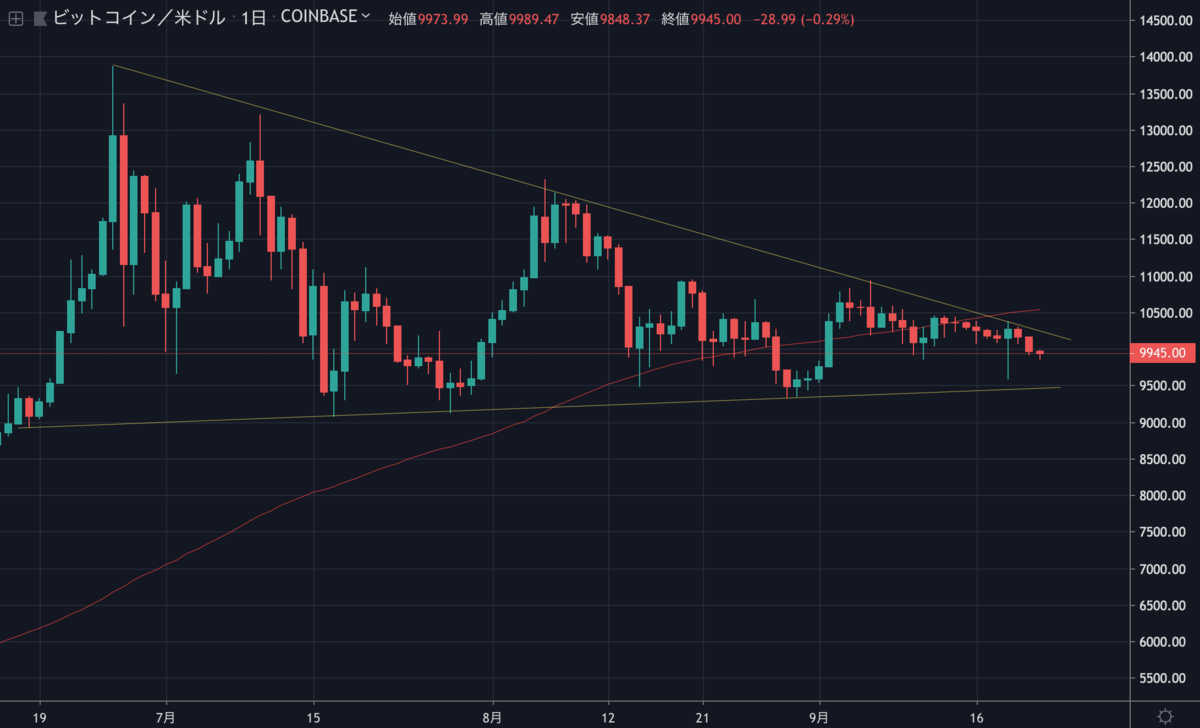
この一週間のビットコインは10,000ドルを割り込み、一時は9,600ドル付近まで下落、その後の反発で10,000ドル台まで回復したものの、上昇は続かず再び下落しています。

現在は9,900ドル付近で取引されていますが、このまま下落を続けるのでしょうか。
NEWS BTCのチャート分析(週間予想)を見てみます。
ビットコインのチャート分析
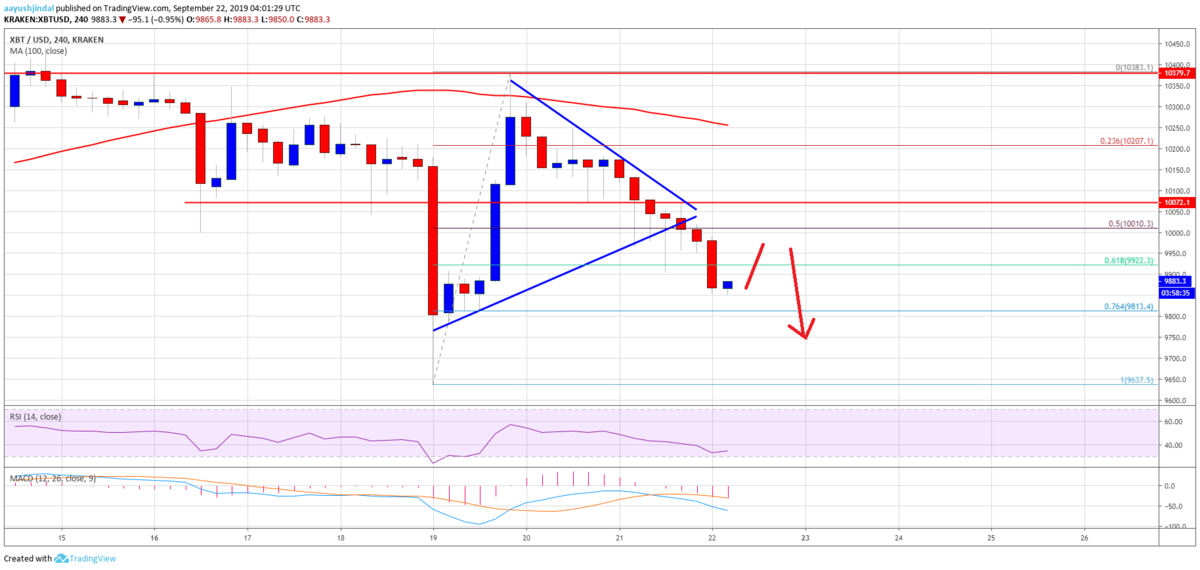
An immediate support is near the $9,800 level. It coincides with the 76.4% Fib retracement level of the last major wave from the $9,637 low to $10,383 high. If there are more downsides, bitcoin price could revisit the $9,650 support area. The main support area is near the $9,500 and $9,400 levels, below which there could be a sharp drop to $9,000.
直近のサポートは9,800ドル付近。これは最近の大きな波(9,637ドル〜10,383ドル)の76.4% Fibリトレースメントレベルと一致します。ここからさらに下落する場合、ビットコインの価格は9,650ドルのサポートエリアまで戻るでしょう。主なサポートエリアは9,500ドルと9,400ドル付近、これを下抜けると9,000ドルまで急落する可能性があります。

On the upside, the recent support near the $10,100 level might act as a resistance. The key resistances are near $10,300, $10,400 and the 100 simple moving average (4-hours). To start a solid upward move, the price must settle above the $10,400 resistance and the 100 simple moving average (4-hours).
上昇する場合は、最近のサポートだった10,100ドル付近がレジスタンスとして機能する可能性があります。重要なレジスタンスは10,300ドルと10,400ドル付近、そして100期間SMA(4時間足)になります。堅実な上昇を始めるには、10,400ドルのレジスタンスと100期間SMA(4時間足)以上で安定する必要があります。
Looking at the chart, bitcoin price is clearly struggling to gain bullish momentum above $10,200 and $10,300. Therefore, there is a risk of additional losses below the $9,800 and $9,650 support levels.
チャートを見ると、ビットコインの価格は明らかに10,200ドルと10,300ドルを突破する勢いが得られずに苦戦しています。そのため、さらに下落して9,800ドルと9,650ドルのサポートレベルを下回る恐れがあります。
via: Bitcoin (BTC) Price Weekly Forecast: Risk Of Additional Losses
_


