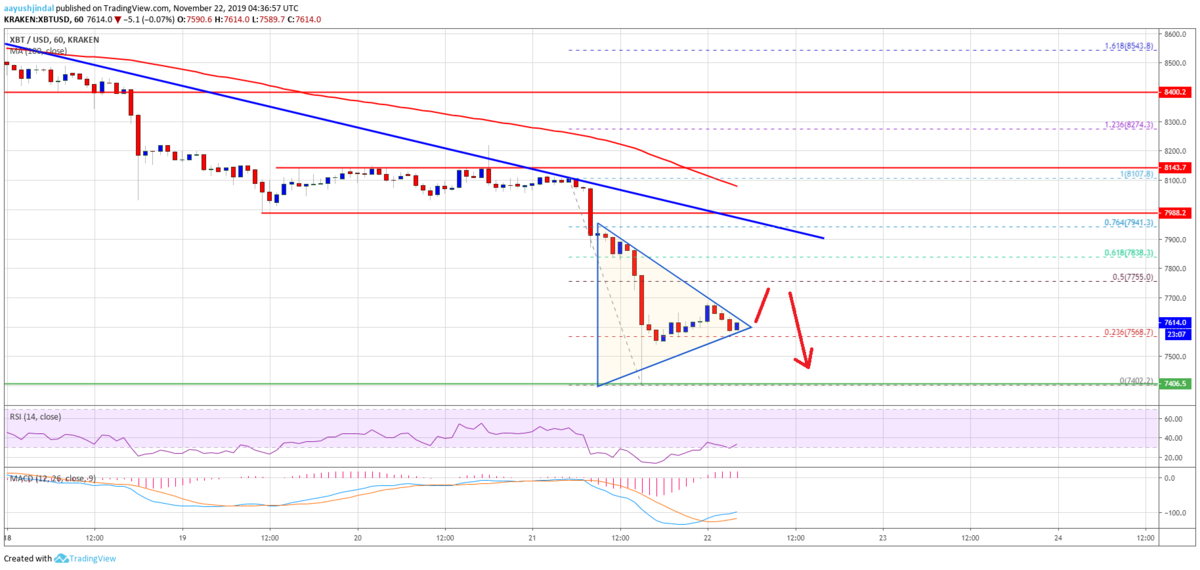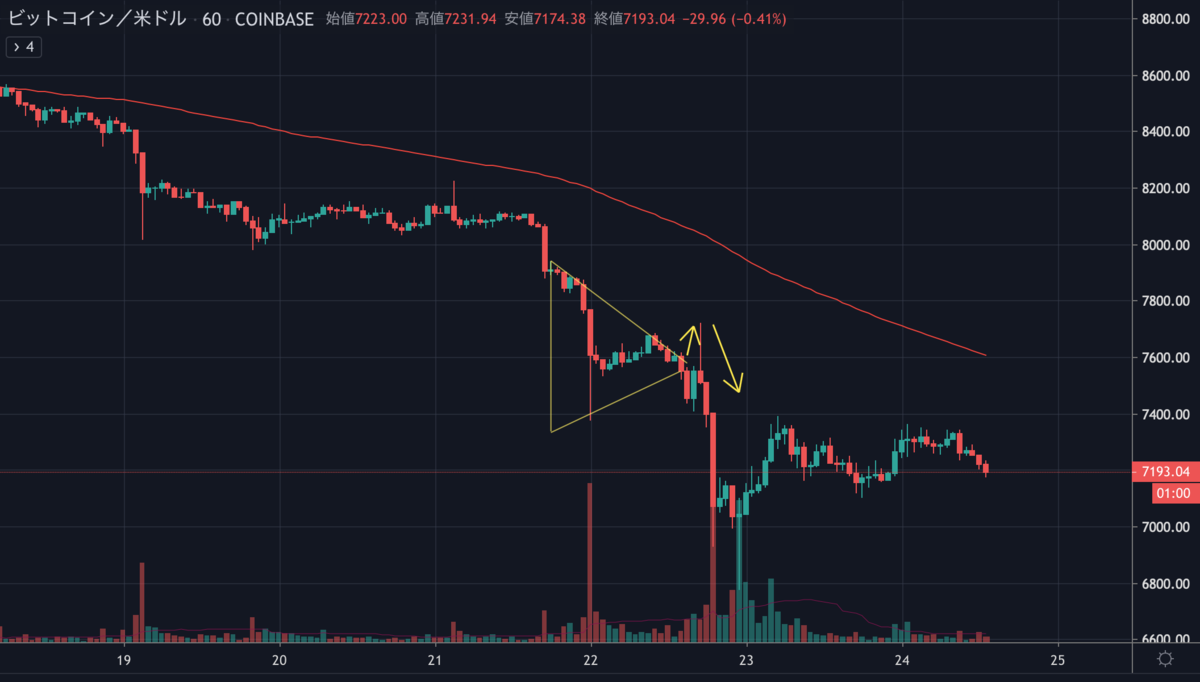
ビットコインはさらに下落を続け、一時は6,800ドルを割り込みました。現在は7,200ドル付近で取引されています。
前回のNEWS BTCの予想図は完全的中と言って良い精度ではないでしょうか。ぱない。

Bitcoin (BTC) Reaches Crucial Support At $7.4K, Larger Decline In Play?

ここしばらく下降トレンドが継続していますが、ビットコインの今後の値動きはどのように予想されているのでしょうか。
NEWS BTCでビットコインのチャート分析(週間予想)を見てみます。
ビットコインのチャート分析
However, the upward correction is facing resistance near the $7,400 level. Additionally, there is another breakdown pattern forming with support near $7,240 on the 4-hours chart of the BTC/USD pair.
上方修正は7,400ドル付近でレジスタンスに直面しています。さらに、BTC/USDペアの4時間足チャートには、7,240ドル付近でサポートとなる新しいブレイクダウンパターンが形成されています。

If there is a downside break below $7,240 and $7,200, there are chances of more downsides in the near term. In the mentioned case, the price is likely to break the $7,000 support and $6,800 level.
7,240ドルと7,200ドルを下抜けると、短期的にはさらに下落する可能性があります。その場合、7,000ドルのサポートと6,800ドル水準を割り込む可能性が高いでしょう。
On the upside, the price must break the triangle resistance and $7,400. Besides, the 50% Fib retracement level of the last decline from the $8,213 high to $6,776 low is near the $7,500 level.
上昇する場合は、価格はトライアングルのレジスタンスと7,400ドルを突破する必要があります。また、最後の下落(8,213ドル〜6,776ドル)の50% Fibリトレースメントレベルが7,500ドル付近にあります。
The key resistance is near the $7,550 level and a connecting bearish trend line on the same chart. A clear break above the $7,500 and $7,550 resistance levels could set the pace for more gains.
重要なレジスタンスは7,550ドル付近と下降トレンドラインです。7,500ドルと7,550ドルのレジスタンスをはっきりと上抜ければ、上昇の勢いをつける可能性があります。
via: Bitcoin Weekly Forecast: BTC Aiming Key $6.5K Support
_


