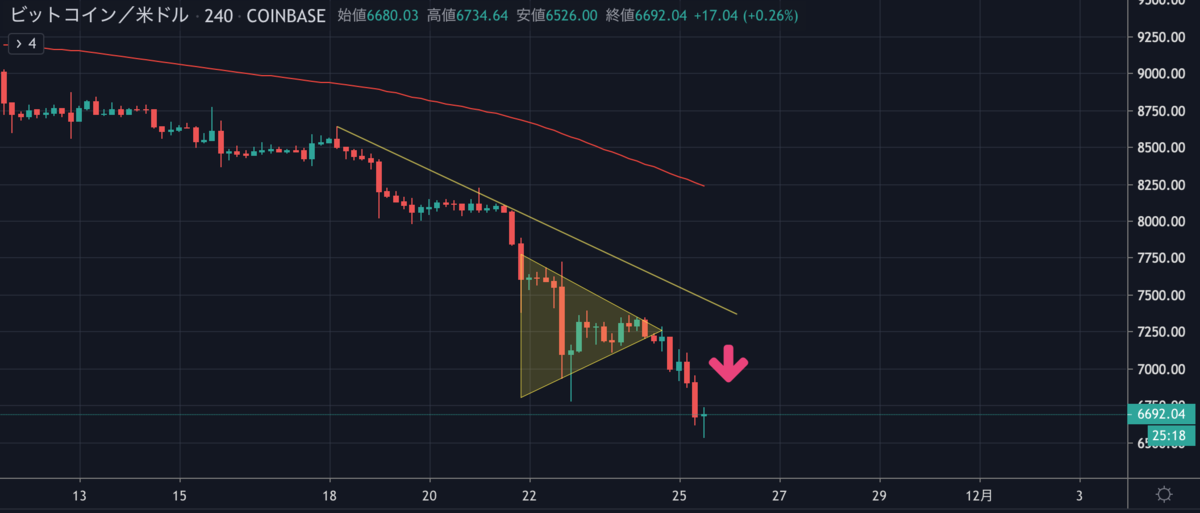
ビットコインが下落を続け、現在は6,700ドル台付近で取引されています。
昨日のNEWS BTCの予想図も的中しています。最近よく当たってますね。

Bitcoin Weekly Forecast: BTC Aiming Key $6.5K Support

ショート勢は今月上旬から2週間以上勝ち続けていることになりますが、今後上昇トレンドに転じる可能性はあるのでしょうか。
NEWS BTCのチャート分析を見てみます。
ビットコインのチャート分析
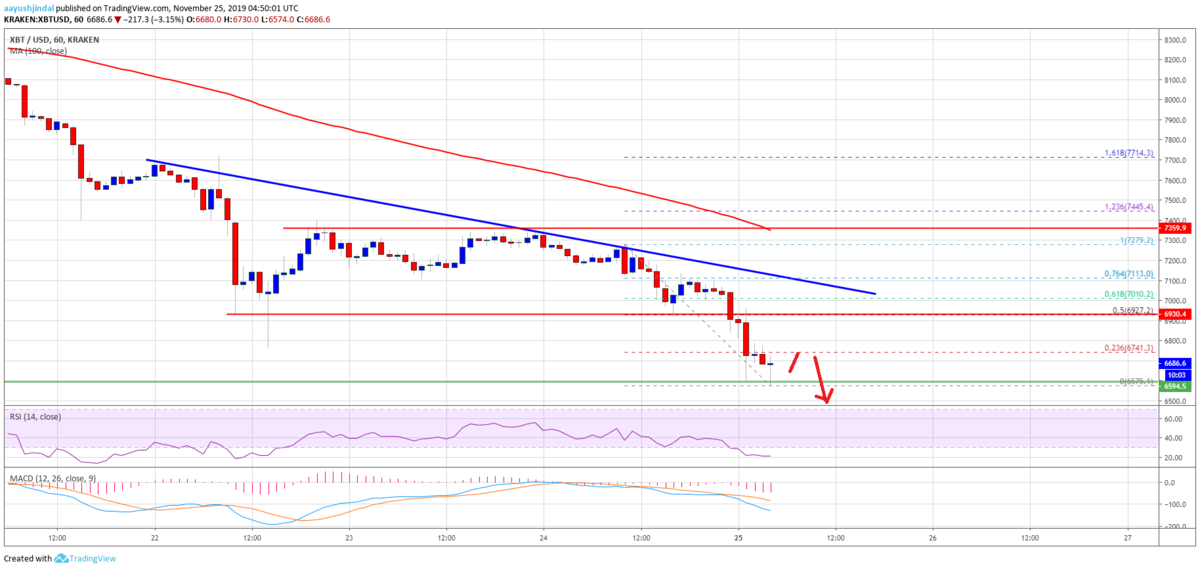
On the upsides, there are many resistances near the $6,880, $6,900 and $6,930 levels. The first major resistance is near the $6,930 level since it is close to the 50% Fib retracement level of the recent downward move from the $7,279 high to $6,575 low.
上昇する場合は、6,880ドル、6,900ドル、6,930ドル付近に多くのレジスタンスがあります。最近の下落(7,279ドル〜6,575ドル)の50% Fibリトレースメントレベルも近くにあるため、最初の強いレジスタンスは6,930ドル付近になります。

Additionally, there is a new connecting bearish trend line forming with resistance near $7,010 on the hourly chart of the BTC/USD pair. Therefore, bitcoin price needs to climb above the $6,930 and $7,000 resistance levels to start a decent recovery.
さらに、BTC/USDペアの時間足チャートには、7,010ドル付近でレジスタンスとなる下降トレンドラインが新たに形成されています。そのため、ビットコインが堅実な回復を始めるには、6,930ドルと7,000ドルのレジスタンスを突破する必要があります、
The next major resistance is near the $7,360 level and the 100 hourly simple moving average. Conversely, the price may perhaps continue to move down below $6,600.
次の強いレジスタンスは、7,360ドルと100時間SMA(単純移動平均線)付近です。逆に、価格が6,600ドルを下抜けて下落する可能性もあります。
The main support is near the $6,500 level, where the bulls are likely to put up a strong fight.
メインサポートは6,500ドル付近、ここで強い買いが入る可能性があります。
Looking at the chart, bitcoin price is clearly struggling to correct above $6,800. Thus, there remains a risk of another slide or spike towards $6,500 and $6,400 before an upside correction.
チャートを見ると、ビットコインの価格は明らかに6,800ドル以上への修正に苦戦しています。そのため、上方修正の前に、依然として6,500ドルと6,400ドルに向けてさらに下落する恐れがあります、
via: Bitcoin (BTC) Price Nears Possible Short Term Bottom At $6.5K
_


