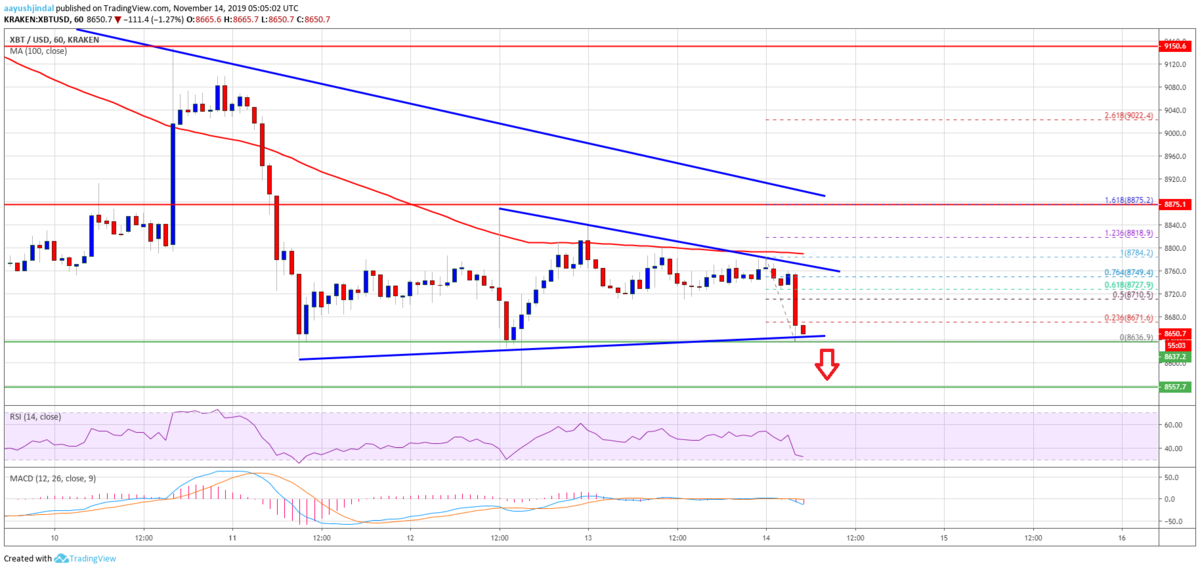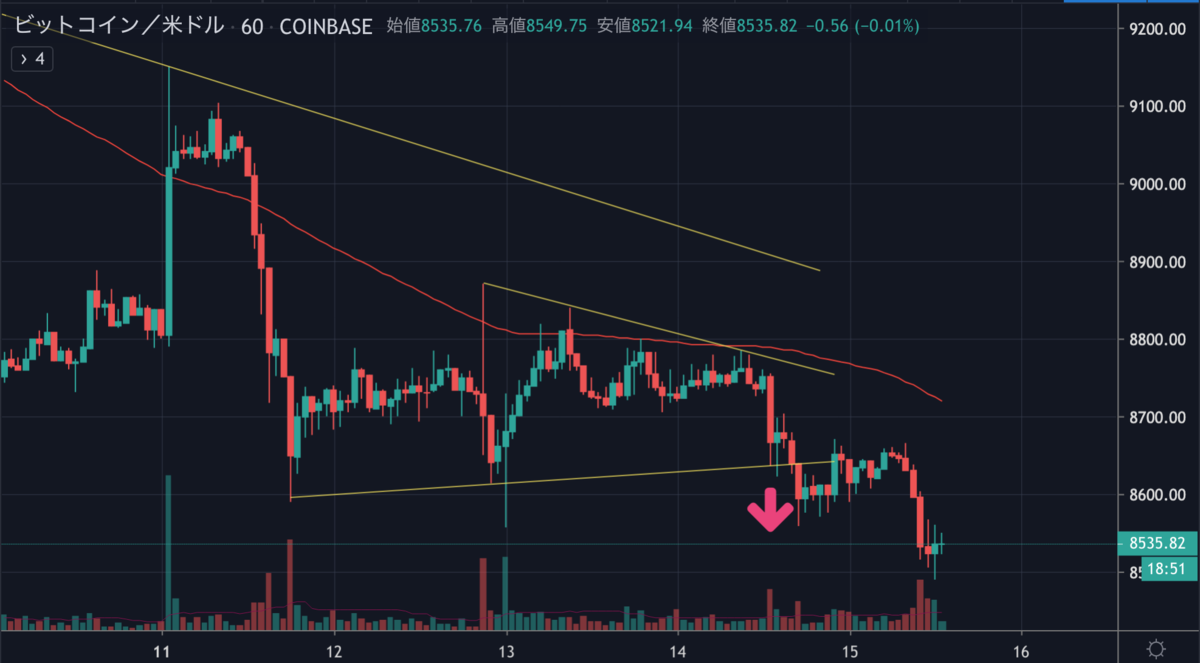
下落を再開したBTCは、サポートラインを下抜け、一時は8,500ドルを割り込みました。

Bitcoin (BTC) Price Poised for Declines Unless It Breaks $9K

BTCはこのまま下落を続け、またしてもショート勢大勝利となるのでしょうか。
NEWS BTCでビットコインのチャート分析を見てみます。
ビットコインのチャート分析
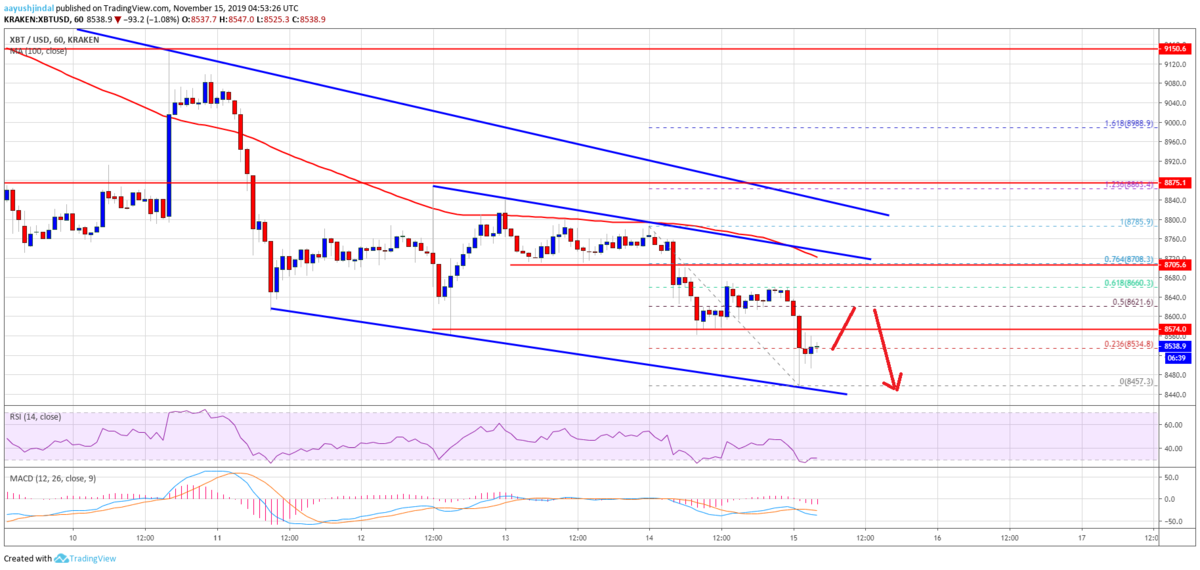
On the upside, an immediate resistance is near the $8,580 and $8,600 levels. The first key resistance for bitcoin is near the $8,620 level.
上昇する場合の直近のレジスタンスは8,580ドルと8,600ドル付近、最初の重要なレジスタンスは8,620ドル付近です。

More importantly, there is a key declining channel forming with resistance near $8,710 on the hourly chart of the BTC/USD pair.
さらに重要なのは、BTC/USDペアの時間足チャートに、8,710ドル付近でレジスタンスとなる重要な下降チャネルが形成されていることです。
The main resistance is near $8,880, above which the price is likely to accelerate higher towards the $9,000 and $9,200 levels. On the downside, an initial support is near the $8,450 level.
メインレジスタンスは8,880ドル付近で、これを上抜けると9,000ドルと9,200ドルに向けて上昇を加速する可能性が高くなります。下落する場合の最初のサポートは8,450ドル付近になります。
If there is another break down below the $8,450 level, the price may perhaps continue to move down below $8,400. The next major support is near the $8,300 and $8,200 levels, where the bulls are likely to appear.
もし8,450ドルの水準を割り込むと、8,400ドル以下まで下落を続けるかもしれません。次の強いサポートは8,300ドルと8,200ドル付近、ここで買いが入る可能性が高いでしょう。
Looking at the chart, bitcoin is clearly trading in a slow and steady decline below $8,700 and $8,800. Thus, there are high chances of more losses below the $8,500 and $8,450 levels. Conversely, a break above $8,700 might start a decent recovery in the near term.
チャートを見ると、ビットコインは8,700ドルと8,800ドル以下でゆっくりと確実に下落しているため、8,500ドルと8,450ドルの水準を割り込む可能性が高いでしょう。逆に、8,700ドルを上抜けると、短期的に大きな回復を始める可能性があります。
via: Bitcoin (BTC) In Slow And Steady Decline, $8.2K Likely Target
_


