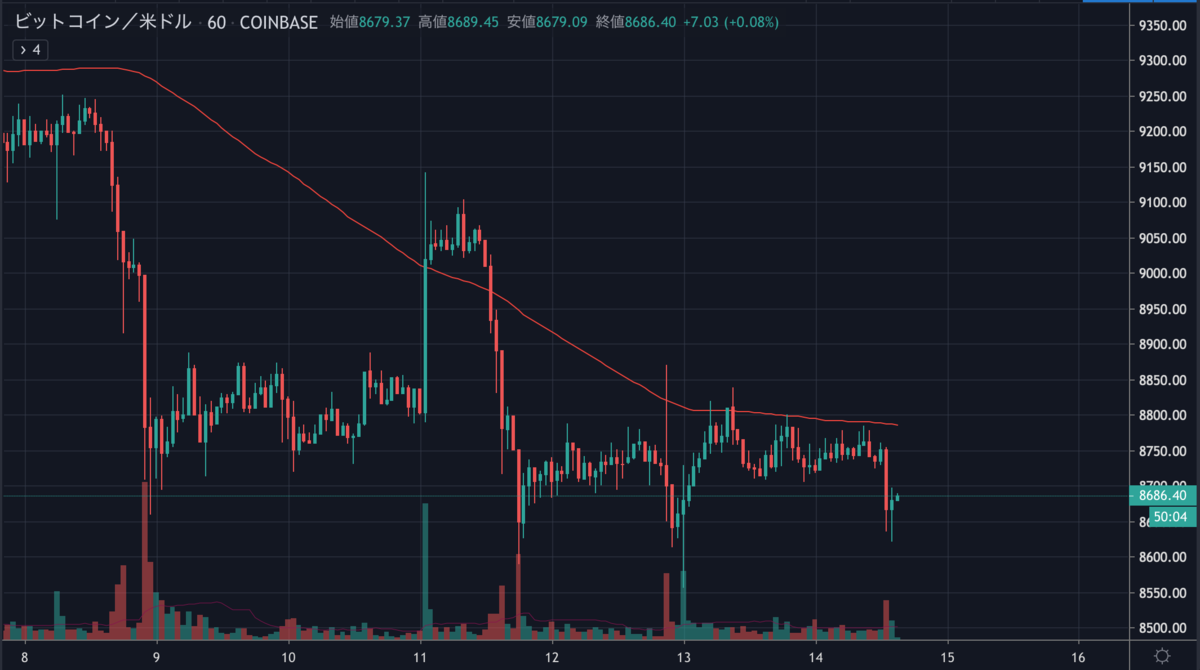
横ばいで推移していたビットコインがまた少し下落しました。上昇トレンドへの転換はまだ厳しそうに見えます。

Bitcoin (BTC) Price Eyeing Fresh Monthly Low Below $8.5K

今後はもう一段の下落が予想されるのでしょうか。
NEWS BTCでビットコインのチャート分析を見てみます。
ビットコインのチャート分析
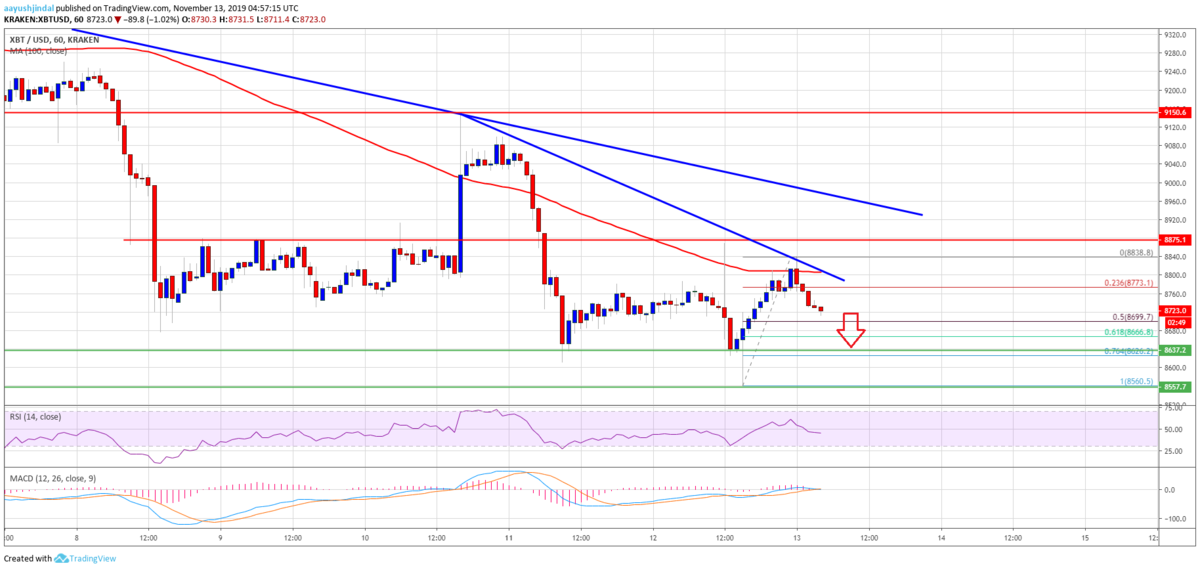
If there is an upside correction, the $8,710 level is an immediate resistance.
もし価格が回復すれば、8,710ドル付近が直近のレジスタンスになります。
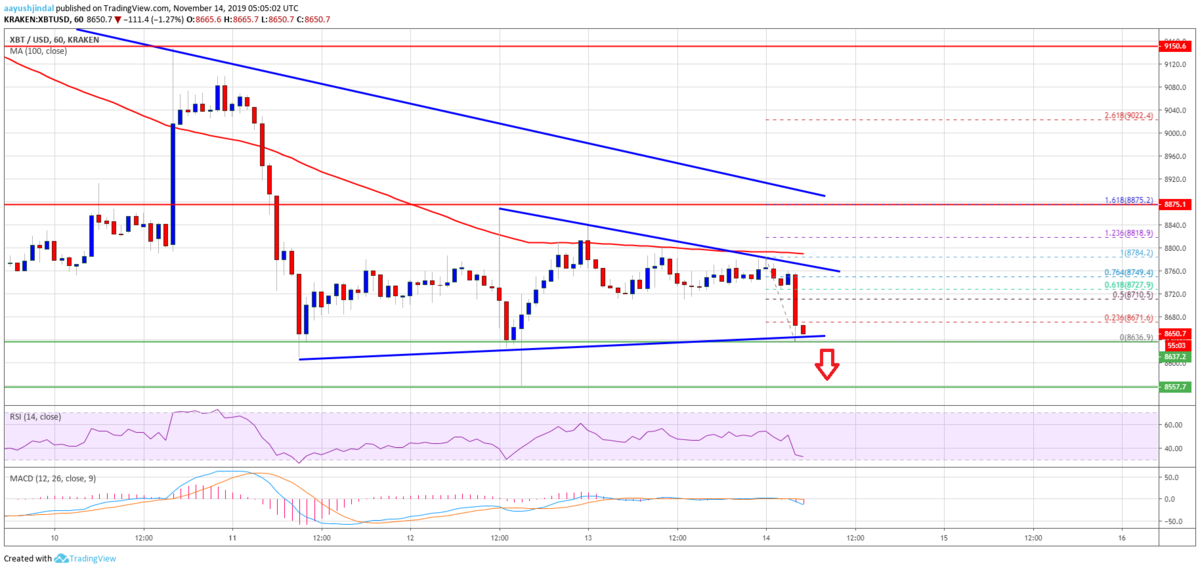
The main resistances on the upside are near the $8,740 and $8,750 levels. More importantly, there is a short term breakout pattern forming with resistance near $8,740 on the hourly chart of the BTC/USD pair.
上昇時のメインレジスタンスは、8,740ドルと8,750ドル付近です。さらに重要なのは、BTC/USDペアの時間足チャートに、8,740ドル付近でレジスタンスとなる短期的なブレイクアウトパターンが形成されていることです。

An intermediate resistance is near the $8,730 level. It represents the 61.8% Fib retracement level of the recent decline from the $8,784 high to $8,636 low. Therefore, bitcoin price might struggle to break the $8,730-$8,750 resistance area.
中間のレジスタンスは8,730ドル付近です。これは、最近の下落(8,784ドル〜8,636ドル)の61.8% Fibリトレースメントレベルを表します。そのため、ビットコインの価格は8730ドル〜8,750ドルのレジスタンスエリアを突破するのに苦戦しそうです。
Furthermore, BTC needs to climb above the key $8,800 and $8,880 resistance levels to move into a positive zone and start a decent recovery.
さらに、BTCがポジティブゾーンに入り堅実な回復を始めるには、重要なレジスタンスである8,800ドルと8,880ドルを上抜ける必要があります。
Conversely, the price might continue to move down if it fails to climb above $8,780, $8,800 and $8,880. An initial support is near the $8,640 level. The next key support is near the $8,600 level, below which the price is likely to accelerate lower towards the $8,500 and $8,300 support area.
逆に、8,780ドル、8,800ドル、8,880ドルの突破に失敗すると、価格は下落を継続する可能性があります。最初のサポートは8,640ドル付近です。次の重要なサポートは、8,600ドル付近で、これを下抜けると、8,500ドルおよび8,300ドルのサポートエリアに向けてさらに下落を加速するでしょう。
via: Bitcoin (BTC) Price Poised for Declines Unless It Breaks $9K
_


