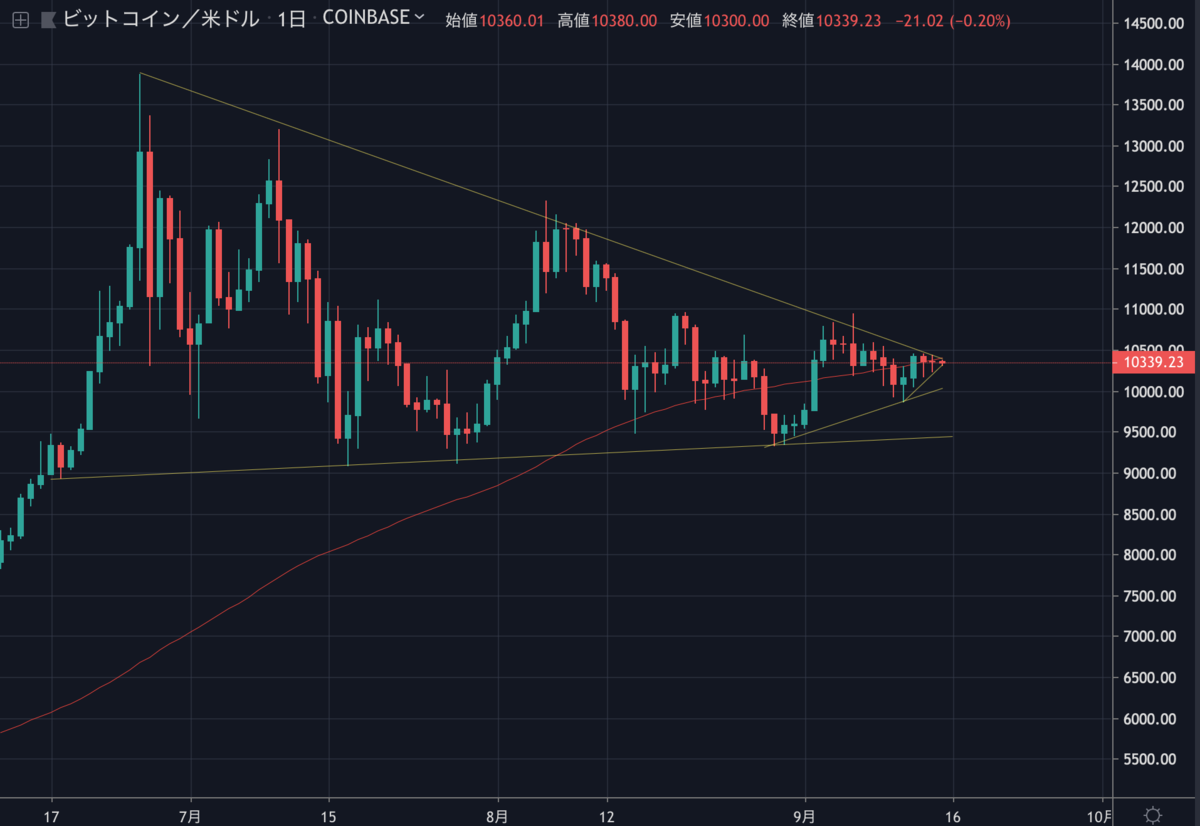
現在のビットコインはまだ大きな動きが見られず、引き続き三角保ち合いを形成しています。

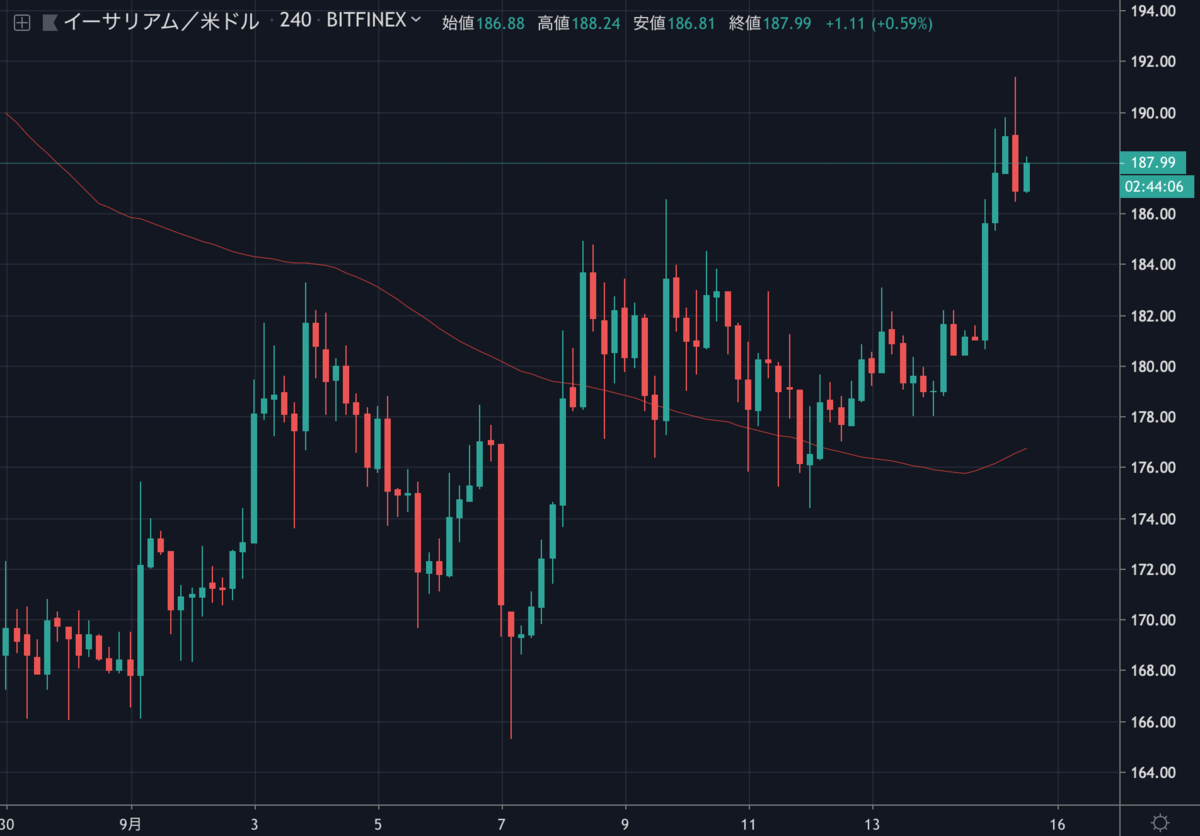
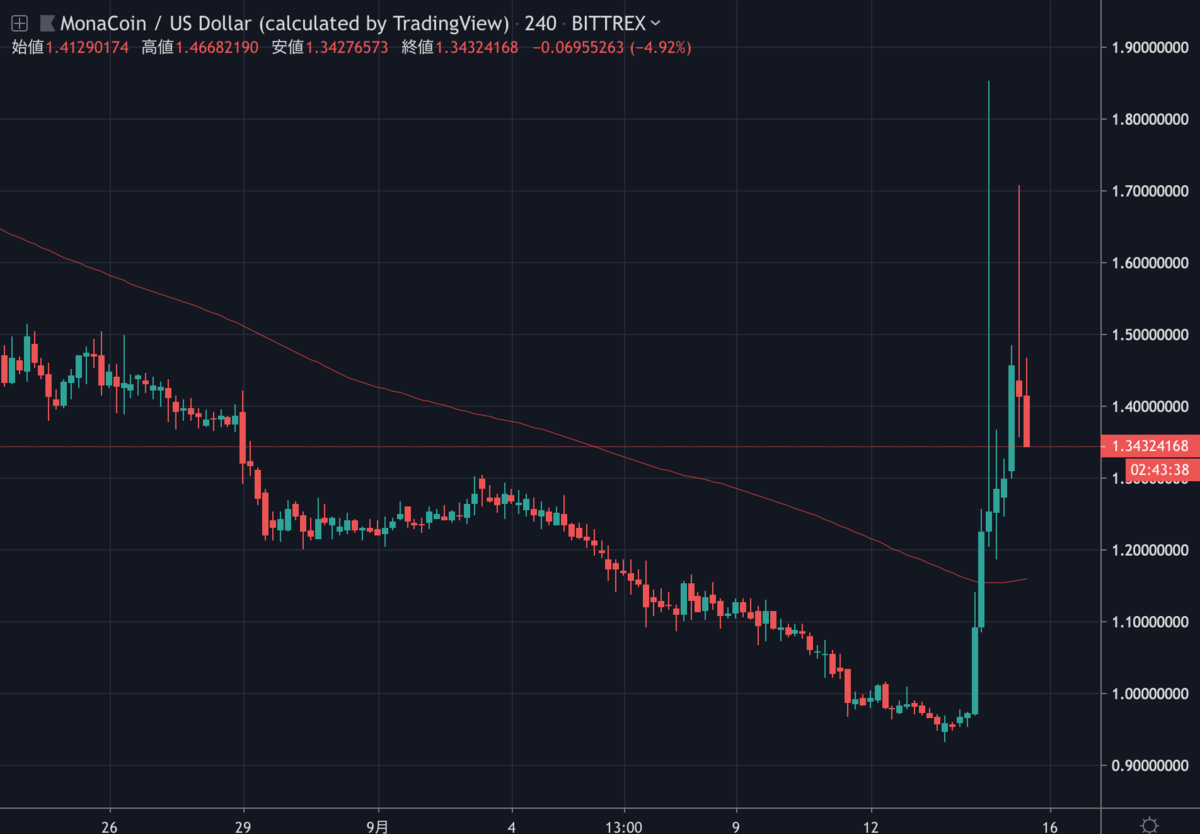
一方、イーサリアム(ETH)などのアルトコインは上昇しつつあり、特にモナコイン(MONA)は、昨日大きく急騰しました。

モナコインは0.95ドル付近から数時間で約90%上昇した後に1.4ドル付近まで価格を戻しましたが、それでも40%近く高騰したことになります。

それはさておき、ビットコインのチャート分析を見てみます。
ビットコインのチャート分析
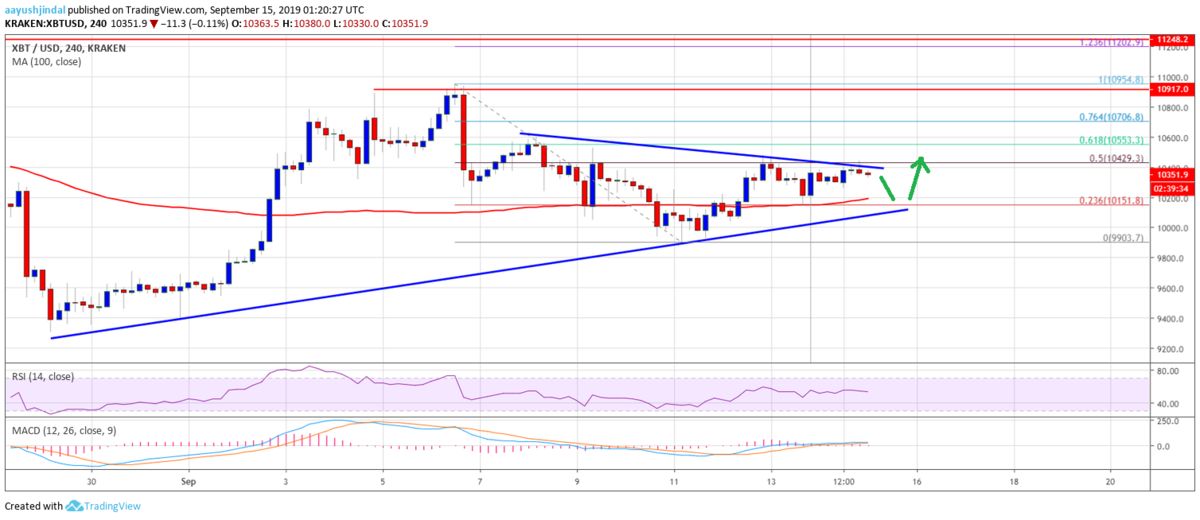
In the last weekly forecast, we saw bitcoin price holding the key $10,000 support area against the US Dollar. The BTC/USD pair climbed higher and traded above the $10,000 resistance area. Moreover, there was a break above the $10,800 level and the 100 simple moving average (4-hours).
先週の週間予想では、ビットコインの対ドル価格が10,000ドルの重要なサポートエリアを維持していたことを確認しました。BTC/USDペアは上昇し、10,000ドルのレジスタンスエリア以上で取引されました。さらに、10,800ドルレベルと100期間単純移動平均線(4時間足)を上回りました。
However, the upward move is facing hurdles near the $10,400 and $10,500 levels. Additionally, the price is also struggling to climb above the 50% Fib retracement level of the last decline from the $10,954 high to $9,903 low. If there is a break above the $10,450 and $10,500 levels, the price could continue to rise. The next key resistance is near the $10,800 level.
しかし、10,400ドルと10,500ドル付近のハードルに上昇が妨げられています。また、前回の下落(10,954〜9,903ドル)の50% Fibリトレースメントレベルでも苦戦しています。もし10,450ドルと10,500ドルを上抜ければ、価格は上昇を続ける可能性があります。次の重要なレジスタンスは10,800ドル付近になります。

On the downside, there are many supports near the $10,100 and $10,000 levels. Additionally, there is a major bullish trend line forming with support near $10,140 on the 4-hours chart of the BTC/USD pair. If there is a downside break below the trend line and the $10,000 support, the price could resume its decline.
下落する場合は、10,100ドルと10,000ドル付近に多くのサポートがあります。また、BTC/USDペアの4時間足チャートでは、10,140ドル付近でサポートとなる大きな上昇トレンドラインがあります。このトレンドラインと10,000ドルのサポートを下抜けると、価格は下落を再開する可能性があります。
via: Bitcoin (BTC) Price Weekly Forecast: Slow And Steady Increase Likely
_


