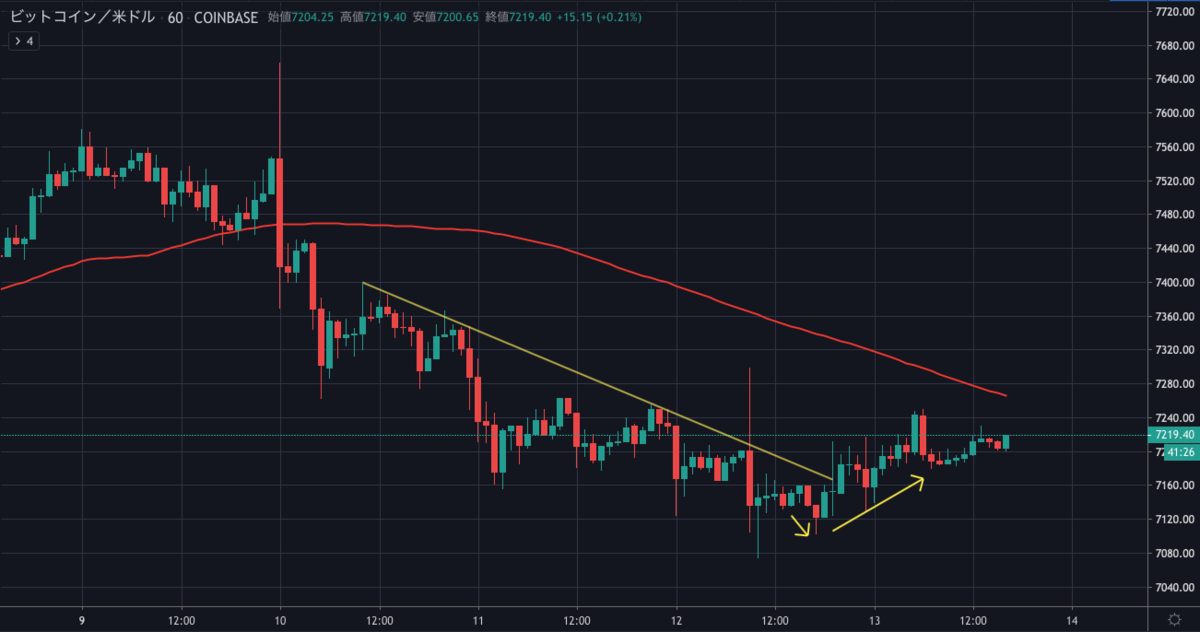
昨日のBTCは、短期的な下降トレンドラインを上抜け、少し回復して現在は7,200ドル付近で取引されています。
7,000ドル付近で底を打ったのでしょうか?

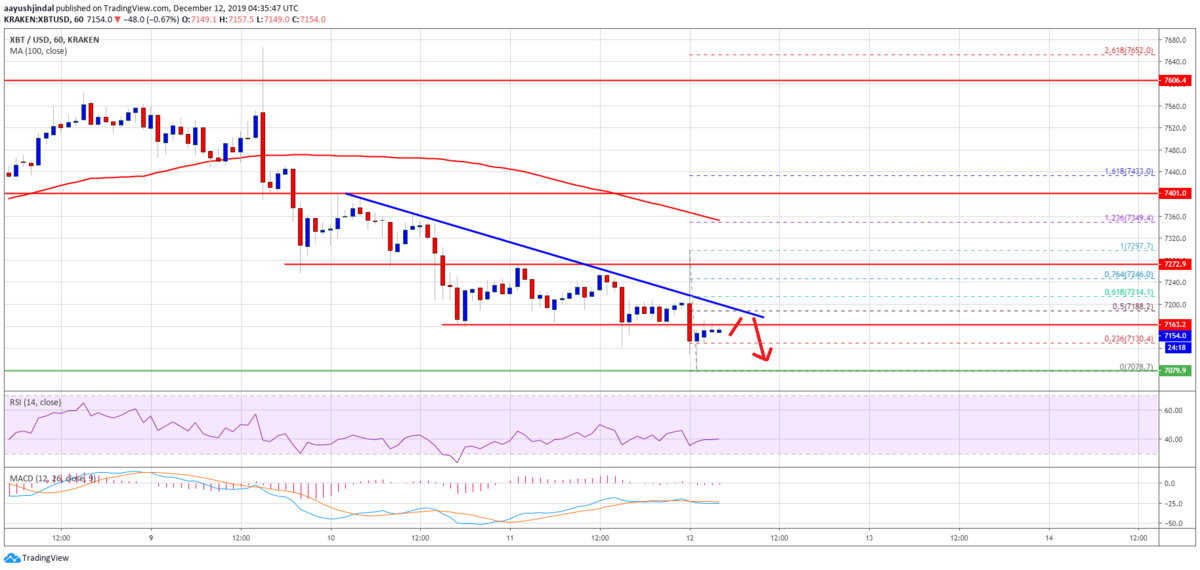
Bitcoin (BTC) Breakdown Below $7K Likely, $6.5K Could Be Next

回復を始めたように見えなくもないBTCですが、今後の値動きはどのように予想されるのでしょうか。
NEWS BTCでビットコインのチャート分析を見てみます。
ビットコインのチャート分析
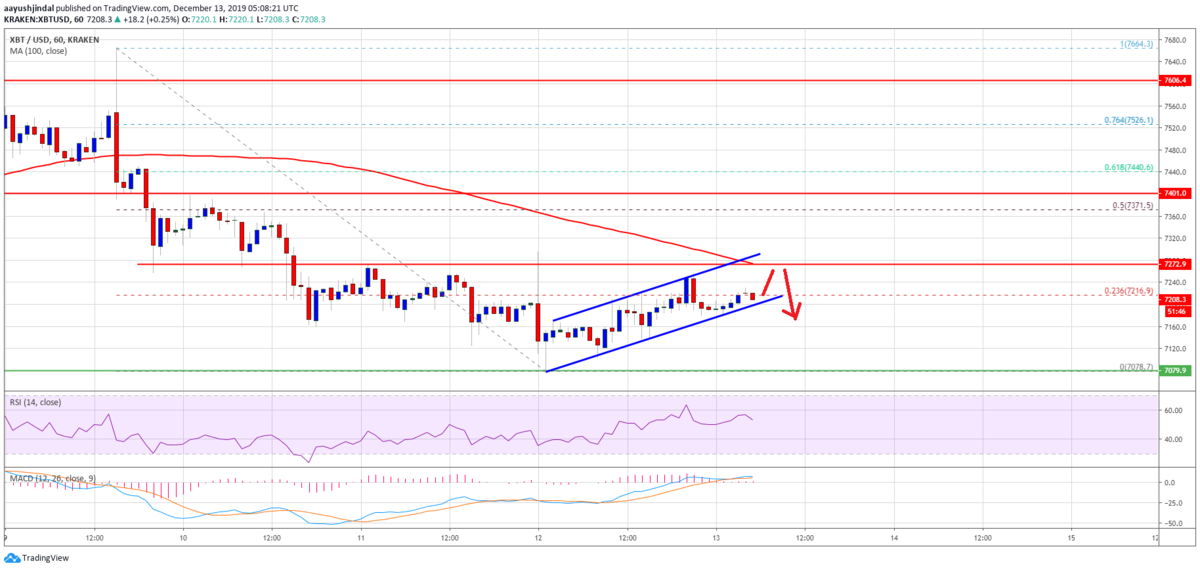
An immediate resistance for bitcoin is near the $7,280 level (the recent breakdown support). Additionally, the 100 hourly simple moving average is also near the $7,280 level.
ビットコインの目先のレジ寸タンスは7,280ドル付近(最近のブレイクダウンサポート)になります。さらに、100時間SMA(単純移動平均線)も7,280ドル付近にあります。

More importantly, there is a short term rising channel forming with resistance near $7,290 on the hourly chart of the BTC/USD pair. If there is an upside break above the $7,280 resistance and the 100 hourly SMA, the price could correct higher towards the $7,400 barrier.
さらに重要なのは、BTC/USDペアの時間足チャートに、7,290ドル付近でレジスタンスとなる短期的な上昇チャネルが形成されていることです。もし7,280ドルのレジスタンスと100時間SMAを突破できれば、価格は7,400ドルに向けてよりいっそう上昇する可能性があります。
An intermediate resistance is near the 50% Fib retracement level of the downward move from the $7,664 high to $7,078 low. A successful close above the $7,400 resistance is needed to start a fresh uptrend towards $8,000.
中間のレジスタンスは、下落の動き(7,664ドル〜7,078ドル)の50% Fibリトレースメントレベル付近です。8,000ドルに向けた新たな上昇トレンドを開始するには、7,400ドルのレジスタンス以上で引ける必要があります。
On the downside, an initial support is near the channel support at $7,180. If there is a downside break below the $7,180 area, the price is likely to revisit the $7,080 level in the near term.
下落する場合は、最初のサポートが7,180ドルのチャネルサポート付近にあります。7,180ドルエリアを下抜けると、価格は近いうちに7,080ドルの水準にまで戻る可能性があります。
via: Bitcoin (BTC) Flirts With Key Resistance, Bears In Control
_


