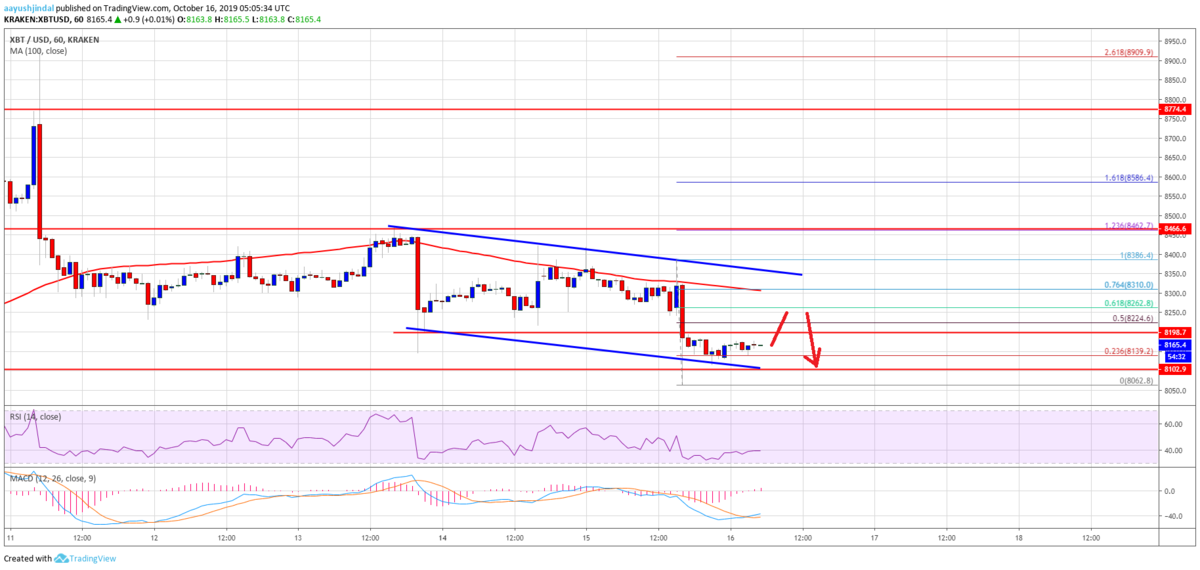
リップル(XRP)が上昇トレンドを維持している一方で、最近のビットコインは下降チャネル内で推移しており、ちょっと上昇しそうになってもすぐに下落するという地味な展開が続いています。
今後もこのままズルズルと下落を続けるのでしょうか。
NEWS BTCでビットコインのチャート分析を見てみます。
ビットコインのチャート分析
An immediate resistance is near the $8,200 level (the recent key support). The next resistance is near the $8,220 level and the 50% Fib retracement level of the recent decline from the $8,386 high to $8,062 low.
直近のレジスタンスは8,200ドル付近(最近の重要なサポート)です。次のレジスタンスは8,220ドルと最近の下落(8,386ドル〜8,062ドル)の50% Fibリトレースメントレベル付近になります。

However, the main resistance for bitcoin is near the $8,300 level and the 100 hourly SMA. Furthermore, there is a key declining channel forming with resistance near $8,350 on the hourly chart of the BTC/USD pair. Therefore, a successful break above the channel resistance and a follow through above $8,400 is must for a decent recovery in the near term.
しかし、ビットコインのメインレジスタンスは8,300ドルと100時間SMA(単純移動平均線)付近です。さらに、BTC/USDペアの時間足チャートでは、8,350ドル付近でレジスタンスとなる下降チャネルが形成されています。したがって、短期的にしっかりと回復するには、チャネルレジスタンスを上抜けて、8,400ドル以上まで上昇を続ける必要があります。
On the downside, there are not many supports up to $8,000. If the bears gain strength, they may perhaps succeed in clearing the $8,000 support area. The next major support is near the $7,800 level, below which the price is likely to head towards the $7,500 zone.
下側には8,000ドルまでそれほど多くのサポートはありません。下落の勢いが付くと、8,000ドルのサポートが突破される可能性もあります。次の強いサポートは7,800ドル付近で、これを下抜けると7,500ドルゾーンに向かう可能性が高いでしょう。
via: Bitcoin (BTC) Price Showing Signs of Additional Weakness
_


