ここ最近のビットコインは大きな動きもなく、7,000ドル付近で推移しています。
短期的には下降トレンドに沿って下落を続けているように見え、7000ドルを割り込む可能性が否定できません。
まだしばらくは回復する見込みがないのでしょうか。
NEWS BTCでビットコインのチャート分析を見てみます。
ビットコインのチャート分析
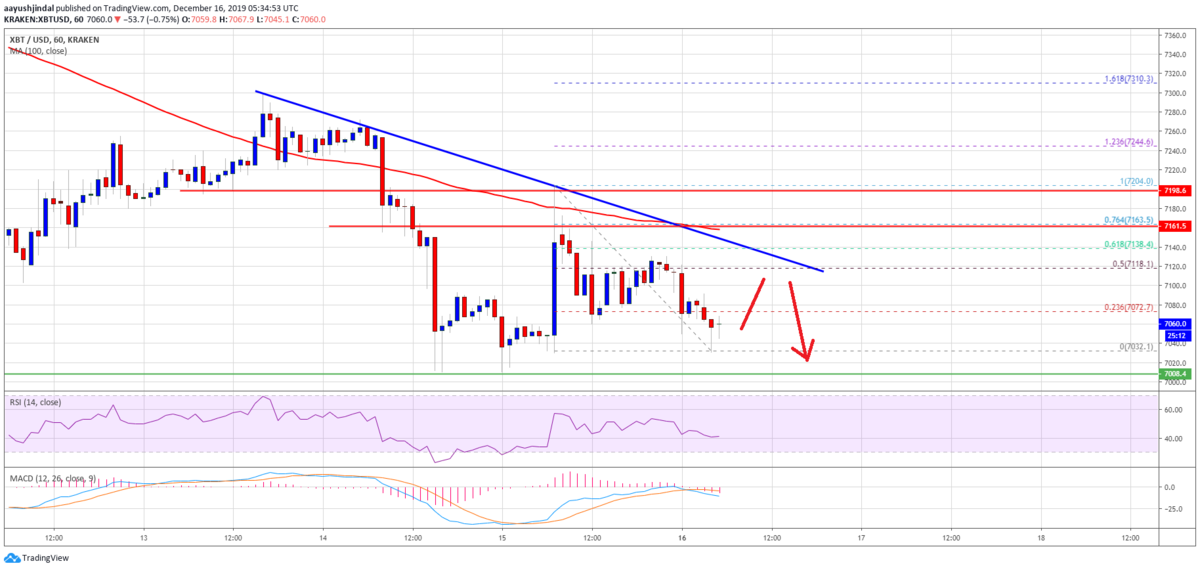
Additionally, there is a connecting bearish trend line forming with resistance near $7,120 on the hoBitcoin (BTC) Breakdown Below $7K Looms, Can Bulls Bounce Back?y chart of the BTC/USD pair.
BTC/USDペアの時間足チャートに、7,120ドル付近でレジスタンスとなる下降トレンドラインが形成されています。
Thus, a clear break above the trend line and $7,120 is needed for a decent recovery. The next hurdles are seen near the $7,160 and $7,180 levels. More importantly, an upside break and close above $7,200 is must to start a substantial recovery.
そのため、しっかりと回復するには、このトレンドラインと7,120ドルを明確に上抜ける必要があります。次のハードルは7,160ドルと7,180ドル付近です。さらに重要なのは、大幅な回復を始めるためには、7,200ドル以上で引ける必要があることです。

On the downside, an initial support is near the $7,030 level. The main support is near the $7,000 level. If there is a successful break and close below $7,000, the bears are likely to gain strength.
下落する場合は、最初のサポートが7,030ドルの付近にあります。メインサポートは7,000ドル付近です。これらを下抜け7,000ドル以下で引けると、売り圧力が増す可能性があります。
In the mentioned case, the price is likely to accelerate below $7,000 and $6,900. An immediate support is near $6,800, below which the gates could open for a test of the $6,500 support area.
その場合、下落が加速して価格は7,000ドルと6,900ドルを下抜ける可能性が高くなります。目先のサポートは6,800ドル、それを割り込むと6,500ドルのサポートエリアを試す可能性が生じます。
Looking at the chart, bitcoin price is clearly trading in a downtrend below $7,160 and $7,200. As long as there is no daily close above $7,200, there are high chances of another breakdown below the $7,000 support area.
チャートを見ると、ビットコインの価格は明らかに7,160ドルと7,200ドルを下回り、下降トレンドで取引されています。日足が7,200ドル以上で引けない限り、7,000ドルのサポートエリアを下抜ける可能性が高いでしょう。
via: Bitcoin (BTC) Breakdown Below $7K Looms, Can Bulls Bounce Back?
_


