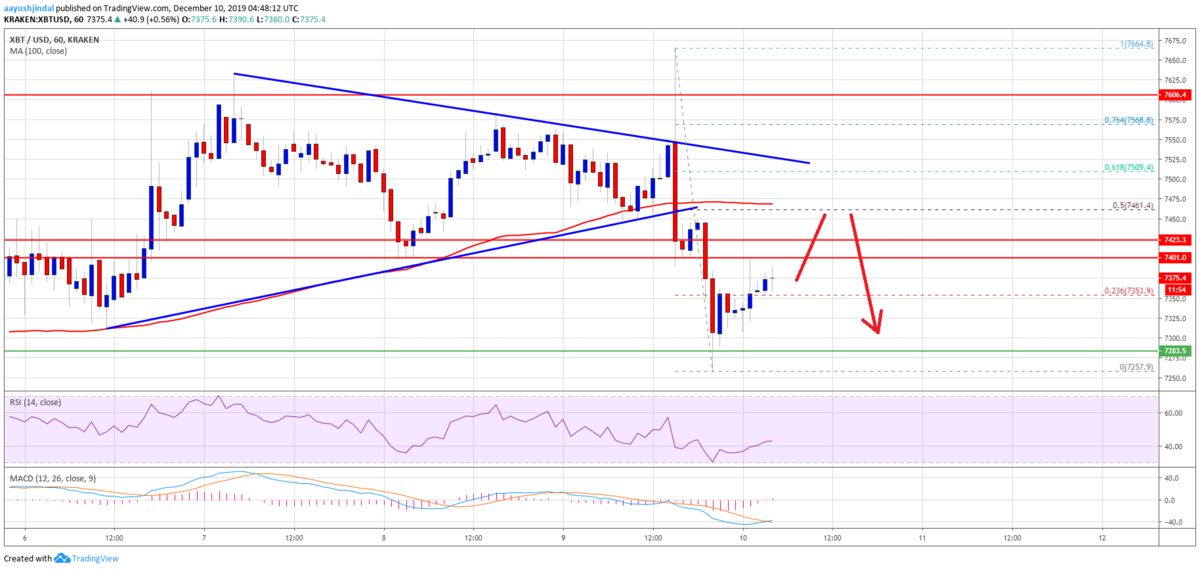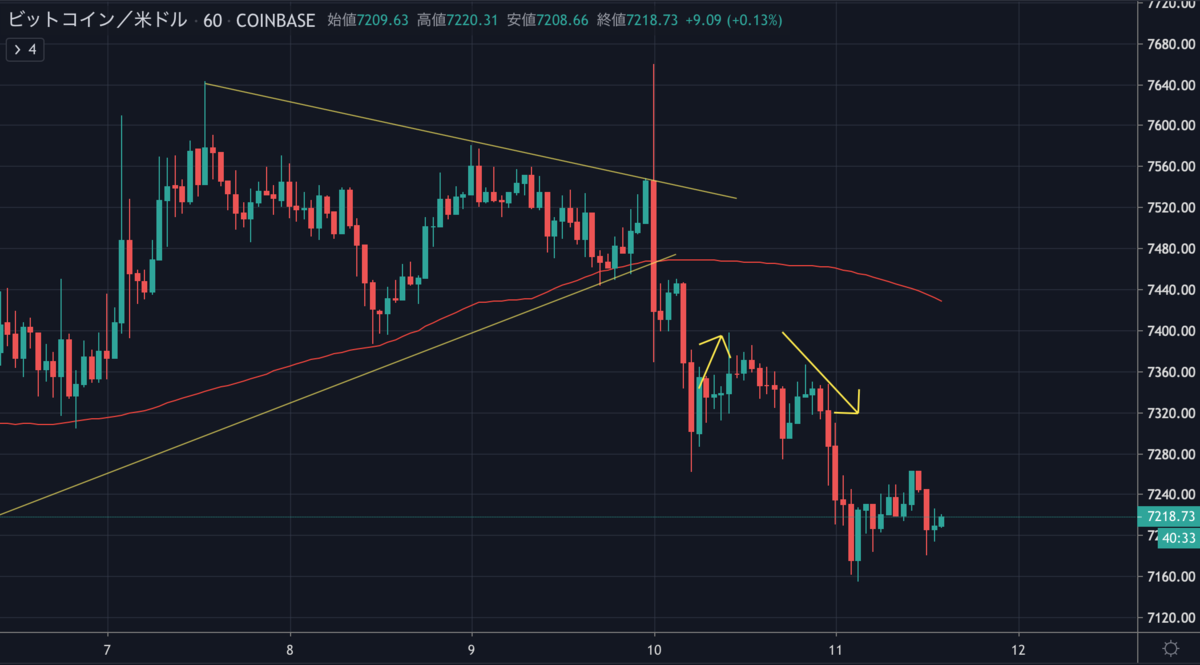
三角保ち合いを下抜けたビットコインは、その後も下落を続け、現在は7,200ドル付近で取引されています。
昨日のNEWS BTCの予想図はほぼ的中といったところでしょうか。

Bitcoin (BTC) Turns Short Term Bearish But Holding Key Support

今後もしばらくは下落を続け、ずっとショート勢のターンになるのでしょうか。
NEWS BTCのチャート分析を見てみます。
ビットコインのチャート分析
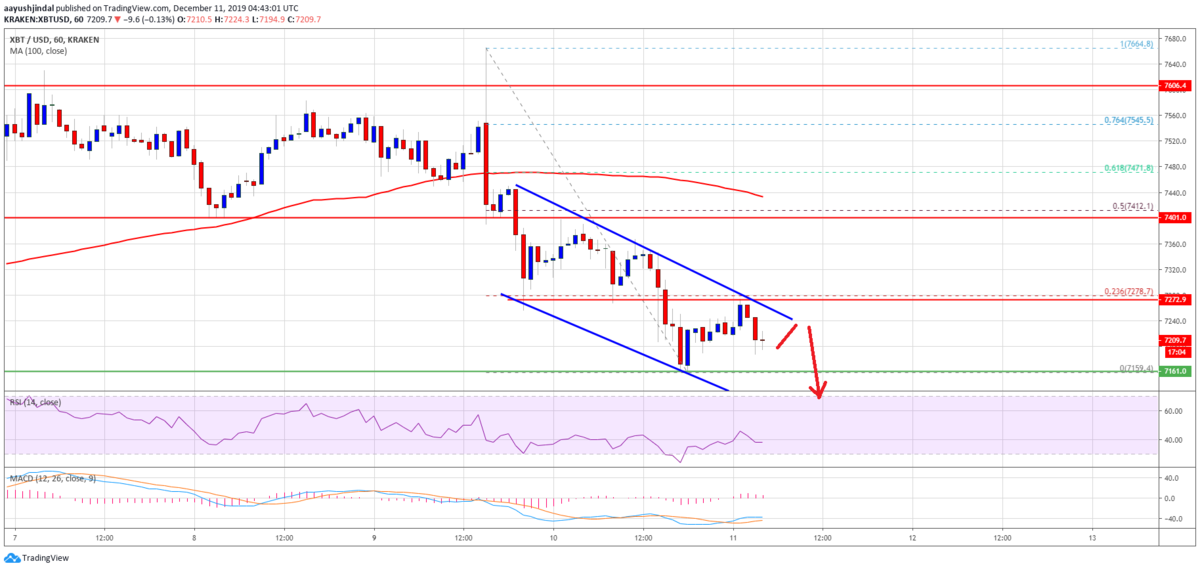
An immediate resistance is near the $7,240 and $7,250 levels. Besides, there is a major declining channel forming with resistance near $7,240 on the hourly chart of the BTC/USD pair.
最初のレジスタンスは7,240ドルと7,250ドル付近になります。また、BTC/USDペアの時間足チャートでは、7,240ドル付近でレジスタンスとなる強い下降チャネルが形成されています。

Above the channel resistance, the $7,280 level is a key resistance. Additionally, the 23.6% Fib retracement level of the recent drop from the $7,664 high to $7,159 low.
このチャネルレジスタンスを上抜けると、7,280ドル付近が重要なレジスタンスになります。さらに、最近の下落(7,664ドル〜7,159ドル)の23.6% Fibリトレースメントレベルもその付近にあります。
If bitcoin manages to recover above $7,240 and $7,280, the price could climb towards the next major resistance near the $7,400 area.
ビットコインが7,240ドルと7,280ドル以上まで回復できれば、7,400ドル付近にある次の強いレジスタンスに向けて上昇する可能性があります。
If the bulls succeed in clearing the $7,400 resistance area, the price could surge towards $7,660 or $7,700. On the other hand, the price may perhaps continue to move down below $7,200.
もし7,400ドルのレジスタンスを突破できれば、7,660ドルか7,700ドルに向けて急騰する可能性があります。その一方で、7,200ドル以下まで下落を続ける可能性もあります。
via: Bitcoin (BTC) Price Downside Thrust Underway, Bulls Struggling
_


