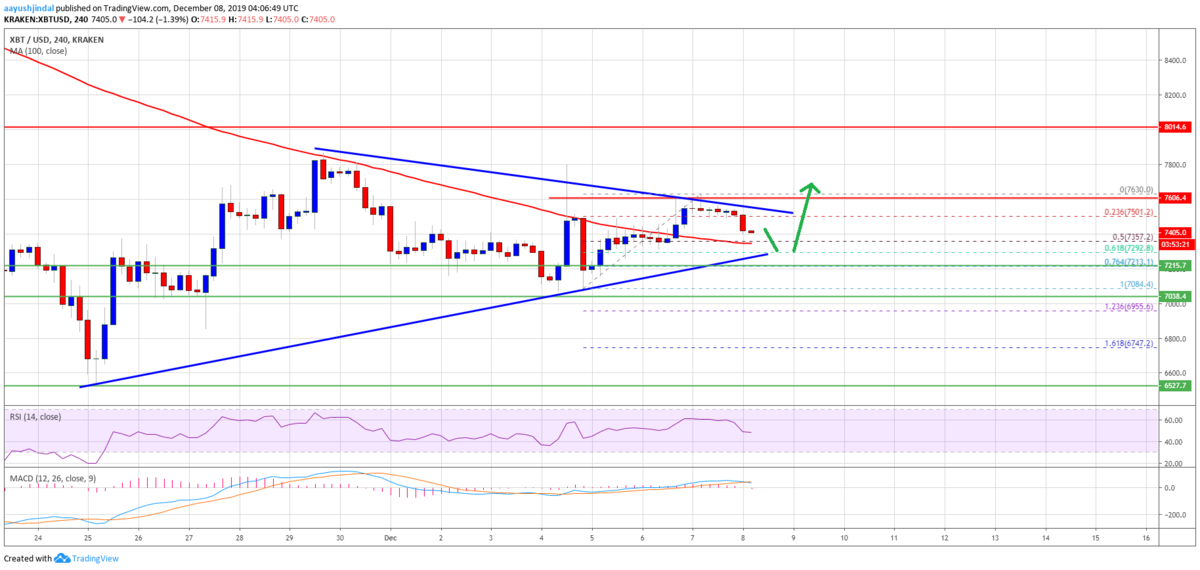
この一週間のビットコインは値幅を縮小しながら三角保ち合いを形成し、現在は7,500ドル付近で取引されています。
保ち合いをどちらかにブレイクして大きく動く可能性が期待されますが、今後の値動きはどのように予想されるのでしょうか。
NEWS BTCでビットコインのチャート分析(週間予想)を見てみます。
ビットコインのチャート分析
On the downside, an immediate support is near the $7,360 level. Additionally, the 50% Fib retracement level of the upward wave from the $7,084 low to $7,630 high is also near the $7,360 level.
下落する場合は最初のサポートが7,360ドル付近にあります。さらに、上昇の動き(7,084ドル〜7,630ドル)の50% Fibリトレースメントレベルも7,360ドル付近にあります。

The first important support is near the $7,300 level (the previous breakout resistance zone) and the 100 simple moving average (4-hours). Therefore, a downside break below the $7,320 support could increase selling pressure on bitcoin.
最初の重要なサポートは、7,300ドル(以前のブレイクアウトレジスタンスゾーン)と100期間SMA(4時間足)付近になります。そのため、7,320ドルのサポートを下抜けると売り圧力が高まる可能性があります。
The next major support is near the $7,220 level. Any further losses may perhaps lead the price towards the $7,080 support area, below which there is a risk a drop below $7,000.
次の強いサポートは7,220ドル付近。さらに下落すると、おそらく7,080ドルのサポートに向かう可能性があり、これを下抜けると7,000ドル以下まで下落する恐れがあります。
On the upside, the price is facing a lot of hurdles near the $7,500 level. More importantly, there is a major contracting triangle forming with resistance near $7,520 on the 4-hours chart of the BTC/USD pair. If there is an upside break above the $7,520 resistance, the price could even rally above the $7,630 high.
上昇する場合は、7,500ドル付近に多くのハードルがあります。さらに重要なのは、BTC/USDペアの4時間足チャートに、7,520ドル付近でレジスタンスとなる三角保ち合いが形成されていることです。7,520ドルのレジスタンスを突破すれば、高値の7,630ドルを超えて上昇する可能性さえあります。
Looking at the chart, bitcoin price is clearly trading above a couple of key supports near $7,220 and $7,080. Thus, there are high chances of an upside break above $7,530 unless the bulls fail to keep the price above $7,220 and $7,080.
チャートを見ると、ビットコインの価格は明らかに7,220ドルと7,080ドル付近のいくつかの重要なサポート以上で取引されています。そのため、7,220ドルと7,080ドルを下抜けない限り、7,530ドルを超えて上方にブレイクする可能性が高いでしょう。
via: Bitcoin Weekly Forecast: BTC Won’t Go Quietly, Risk of Bounce Grows
_


