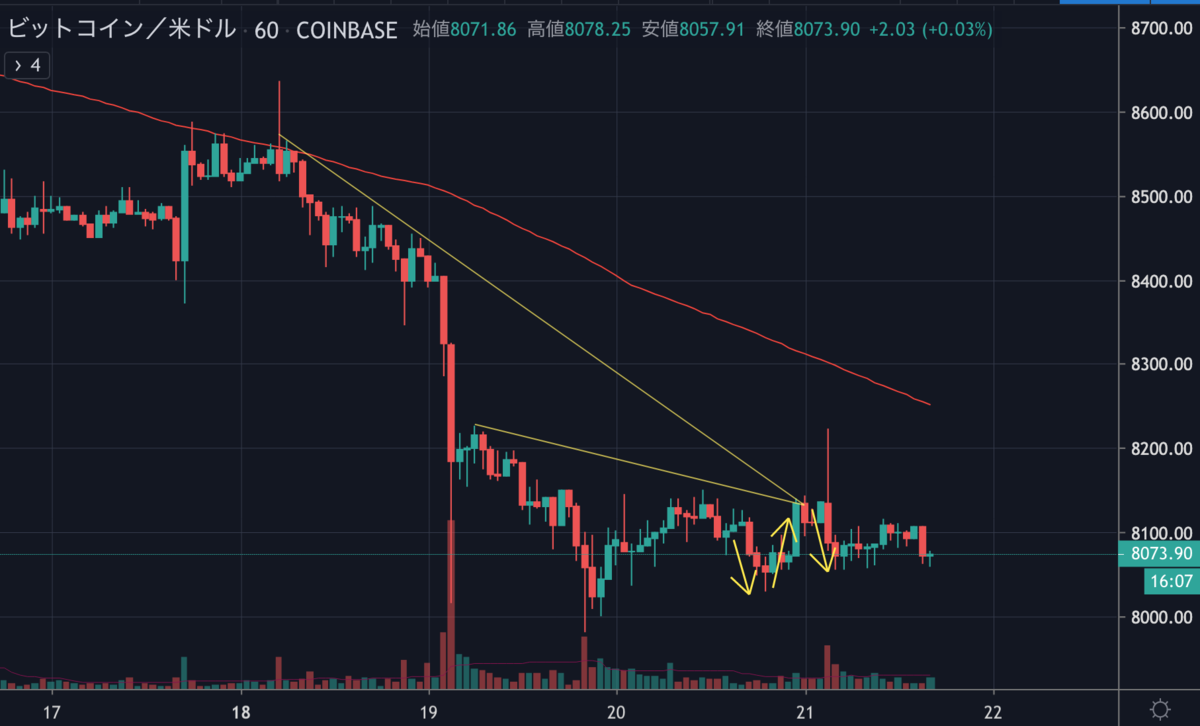
昨日のビットコインは、一時8,200ドル付近まで上昇したものの再び下落、長い上ひげを作り現在は8,000ドル付近で取引されています。

Bitcoin (BTC) Price Primed For Breakdown Below $8K

ショート勢が含み益を伸ばしている中、ビットコインはもう底を売ったと見るアナリストもいるようですが、NEWS BTCでは今後の値動きをどのように予想しているのでしょうか。ビットコインのチャート分析を見てみます。
ビットコインのチャート分析
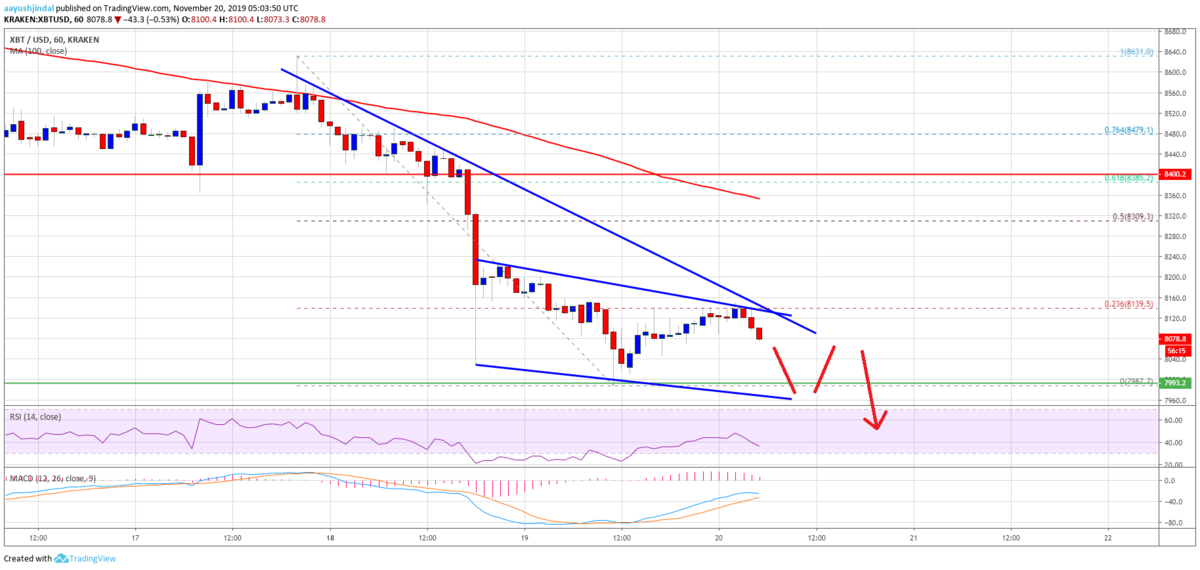
An intermediate resistance is near the $8,280 level and the 100 hourly simple moving average. To move into a positive zone, the price must settle above the $8,300 resistance and the 100 hourly SMA.
中間のレジスタンスは、8,280ドルと100時間SMA(単純移動平均線)付近になります。ポジティブゾーンに入るためには、価格が8,300ドルのレジスタンスと100時間SMA以上で安定する必要があります。

Besides, the 50% Fib retracement level of the downward move from the $8,630 high to $7,990 low is also near the $8,310 level to act as a resistance.
さらに、下落の動き(8,630ドル〜7,990ドル)の50% Fibリトレースメントレベルも、8,310ドル付近でレジスタンスとして機能しています。
Conversely, the price could struggle to climb above the $8,150 and $8,220 resistance levels. On the downside, an initial support is near the $8,060 level. More importantly, there is a key rising channel or a bearish flag pattern forming with support near $8,060 on the hourly chart of the BTC/USD pair.
しかし、価格は8,150ドルと8,220ドルのレジスタンスを突破するのに苦労するかもしれません。下落する場合の最初のサポートは8,060ドル付近です。さらに重要なのは、BTC/USDペアの時間足チャートに8,060ドル付近でサポートとなる重要な上昇チャネル、または弱気のフラッグパターンが形成されていることです。
Therefore, a downside break below the channel support near $8,060 will most likely push the price further lower.
そのため、8,060ドル付近のチャネルサポートを下抜けると、さらに下落する可能性が高くなります。
Looking at the chart, bitcoin price is likely forming anther breakdown pattern with support near $8,060 and $8,000. On the other hand, the bulls need to gain momentum above $8,220 and $8,300 to negate the current bearish view.
チャートを見ると、ビットコインの価格は8,060ドルと8,000ドル付近でサポートとなる新たなブレイクダウンパターンを形成しそうです。一方、現在の弱気を打開するには、8,220ドルと8,300ドルを超える勢いが必要になります。
via: Bitcoin (BTC) Price Hesitates But Further Downsides Seem Likely
_


