激動の9月を終え、昨夜から徐々にビットコインの価格が上がってきました。
イーサリアムもかなり回復していますが、年末に向けて市場全体がこのまま上昇を続けてくれるのでしょうか?
NEWS BTCのチャート分析を見てみます。
ビットコインのチャート分析
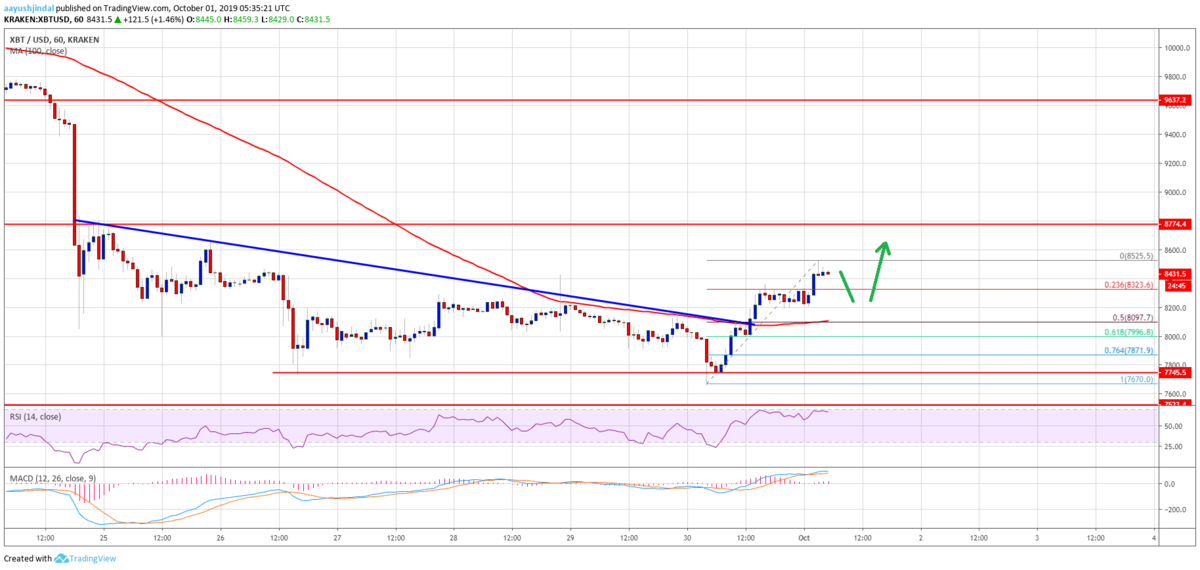
The pair gained strength above $8,300 and surpassed $8,400. It even spiked above the $8,500 level and traded to a new weekly high at $8,525.
BTC/USDペアは8,300ドル以上で勢いを付け8,400ドルを突破しました。さらに8,500ドルを突破し、一週間の最高値となる8,525ドルまで急騰しました。

If the price fails to stay above $8,300, it could correct lower towards the key $8,050 and $8,000 support levels. Besides, the 50% Fib retracement level of the recent wave from the $7,670 low to $8,525 high could provide support near $8,100.
価格が8,300ドル以上を維持できない場合は、重要なサポートである8,050ドルと8,000ドルに向けて下落する可能性があります。さらに、最近の波(7,670ドル〜8,525ドル)の50% Fibリトレースメントレベルが、8,100ドル付近でサポートになり得ます。
The 100 hourly SMA is also positioned near the $8,100 level to act as a support. Therefore, a close below $8,000 and the 100 hourly SMA might push the price back into a bearish zone. On the upside, an immediate resistance is near the $8,500 level. However, the main resistance is near the $8,750 level (the previous support area).
また、100時間SMAも8,100ドル付近でサポートとして機能しそうです。そのため、8,000ドルと100時間SMA(単純移動平均線)以下で引けた場合は、弱気ゾーンに押し戻される可能性があります。上昇時の直近のレジスタンスは8,500ドル付近ですが、メインのレジスタンスは8,750ドル付近になります(以前のサポートエリア)。
Looking at the chart, bitcoin seems to be correcting higher above $8,300. Having said that, there are two important barriers for the bulls – $8,500 and $8,750. If they succeed in clearing $8,750, the price could rise sharply towards $9,000 and $9,200.
チャートを見ると、ビットコインは8,300ドル以上まで回復しているように見えます。しかし、8,500ドルと8,750ドルが強気派にとっての二つの重要なハードルです。もし8,750ドルを突破できれば、9,000ドルと9,200ドルに向けて急騰する可能性があります。
via: Bitcoin Price (BTC) Upward Drift Facing Key Resistance
_


