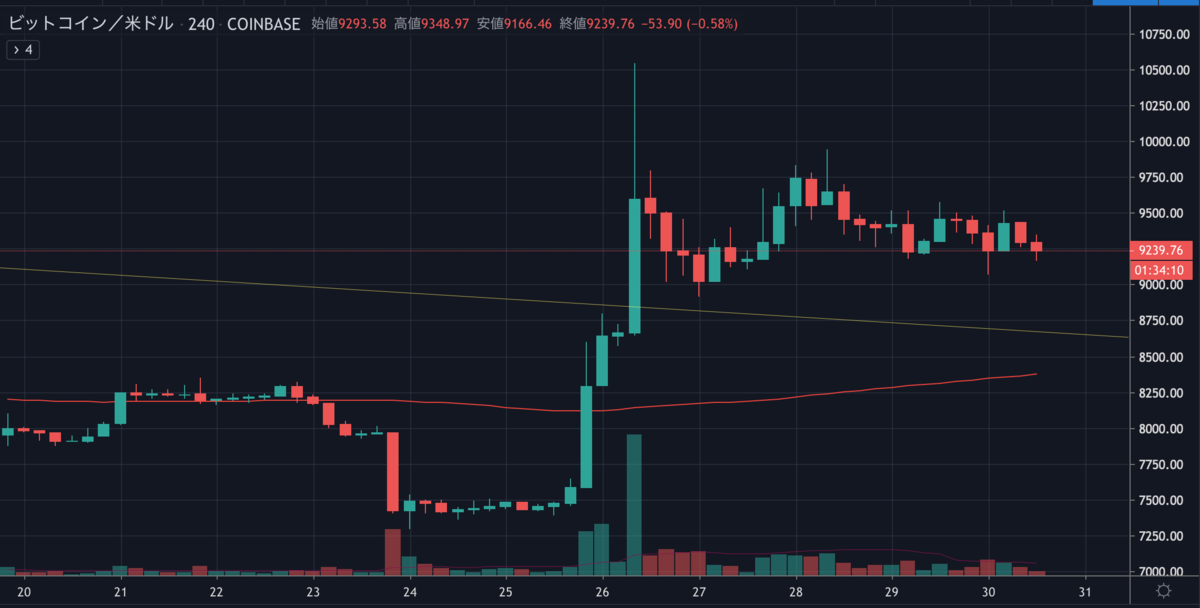
ビットコインは先日の高騰以来もみ合っており、現在は9,200ドル付近で取引されています。

再び1万ドル台まで高騰するには上値抵抗線を突破する勢いが必要になりそうですが、今後の値動きはどのように予想されるのでしょうか。
NEWS BTCでビットコインのチャート分析を見てみます。
ビットコインのチャート分析
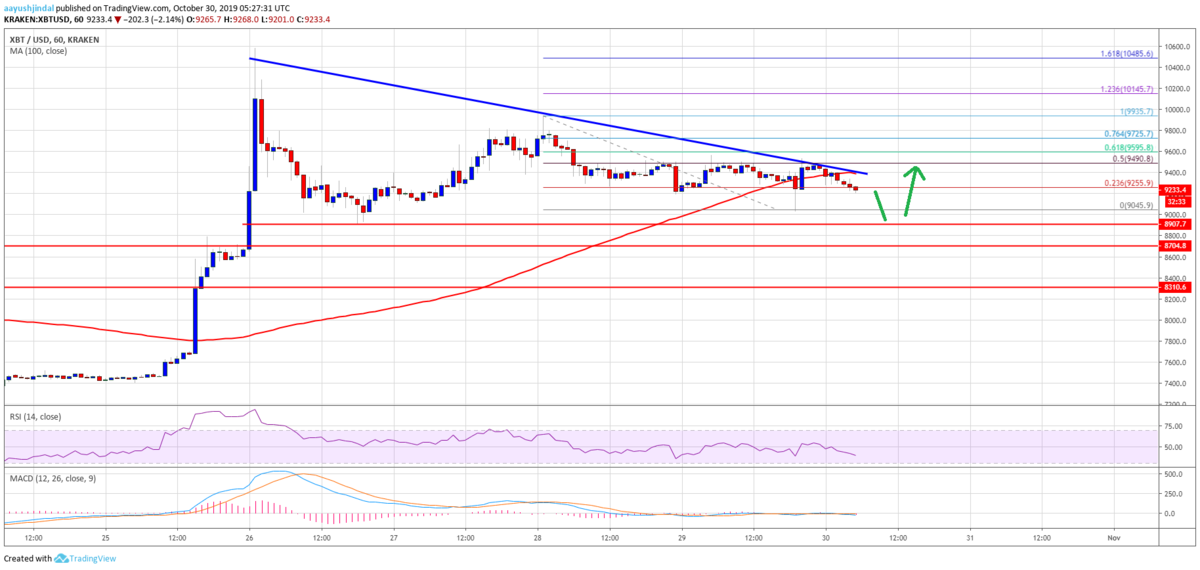
Bitcoin even climbed above the $9,400 level and the 100 hourly simple moving average. However, the upward move was capped by the $9,500 resistance area.
ビットコインは9,400ドルと100時間SMA(単純移動平均線)を突破したものの、上昇は9,500ドルのレジスタンスエリアで抑えられました。

More importantly, yesterday’s highlighted key bearish trend line is intact with resistance near $9,460 on the hourly chart of the BTC/USD pair. The 100 hourly SMA is also near the trend line and $9,500.
さらに重要なのは、BTC/USDペアの時間足チャートで、昨日注目した9,460ドル付近でレジスタンスとなる重要な下降トレンドラインが破られていないことです。100時間SMAもトレンドラインと9,500ドル付近にあります。
Therefore, a clear break above the trend line and the 100 hourly SMA could open the doors for a fresh increase above the $9,500 resistance. The next key resistances are near the $9,725 and $9,880 levels.
そのため、トレンドラインと100時間SMAをはっきりと上抜ければ、9,500ドルのレジスタンスを超える新たな上昇の可能性が生まれます。次の重要なレジスタンスは9,725ドルと9,880ドル付近です。
On the downside, there are many supports near the $9,040 and $9,000 levels. It seems like the price could spike below the $9,000 support area and test $8,800 or $8,700. Once the current wave completes near the $8,800 or $8,700 support, the price is likely to bounce back in the coming sessions.
下落する場合は、9,040ドルと9,000ドル付近に多くのサポートがあります。9,000ドルのサポートエリアを下抜け、8,800ドルまたは8,700ドルを試しそうに見えます。現在の波が8,800ドルまたは8,700ドルのサポートエリア付近で完了すれば、今後価格は反発する可能性があります。
via: Bitcoin (BTC) Price Could Dip Further Before Fresh Rally
_


