昨日までじわじわと下落していたビットコインは、下降チャネルを上抜けて急騰しました。
このまま8,500ドルを突破して上昇トレンドに転換すると良いのですが、今後の値動きはどのように予想されるのでしょうか。
NEWS BTCでビットコインのチャート分析を見てみます。
ビットコインのチャート分析
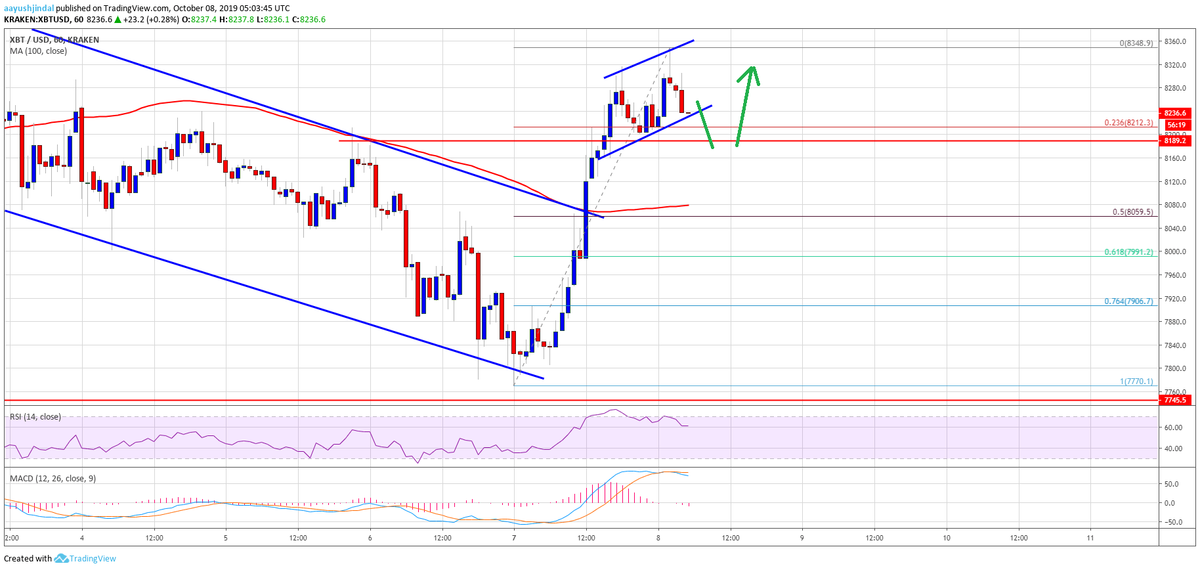
It seems like there is a rising channel forming with support near the $8,200 level on the same chart.
チャート上には、8,200ドル付近でサポートする上昇チャネルが形成されつつあるように見えます。

If there is a downside break below the channel support, the price could correct lower towards the $8,150 level. The main support on the downside is near the $8,050 level and the 100 hourly simple moving average.
チャネルサポートを下抜けた場合、8,150ドル台に向けて価格を調整する可能性があります。下落時のメインのサポートは、8,050ドル台と100時間SMA(単純移動平均線)になります。
Any further declines could push the price towards $8,000 or the 61.8% Fib retracement level of the recent rebound from the $7,770 low to $8,348 high. On the upside, there are many hurdles near $8,350, $8,400 and $8,500. A successful close above the $8,500 resistance is must for the price to move into a positive zone.
さらに下落する場合、8,000ドルまたは最近の反発(7,770ドル〜8,348ドル)の61.8% Fibリトレースメントレベルまで下落する可能性があります。上昇時は、8,350ドル、8,400ドル、8,500ドル付近に多くのハードルがあります。価格がポジティブゾーンに入るためには、8,500ドルのレジスタンス以上で引ける必要があります。
Looking at the chart, bitcoin is rebounding from the $7,770 swing low. However, the price is still trading well below the main $8,500 resistance area. In the short term, there could be another dip towards $8,150 or $8,050 before the price climbs above $8,350.
チャートを見ると、ビットコインは7,770ドルの安値から回復しつつあります。しかし、まだ主要な8,500ドルのレジスタンスを大きく下回ったままです。短期的には、8,350ドルを超える前に、8,150ドルまたは8,050ドルに向けてさらに下落する可能性があります。
via: Bitcoin Price (BTC) Rebounding But $8.5K Resistance Holds Key
_


