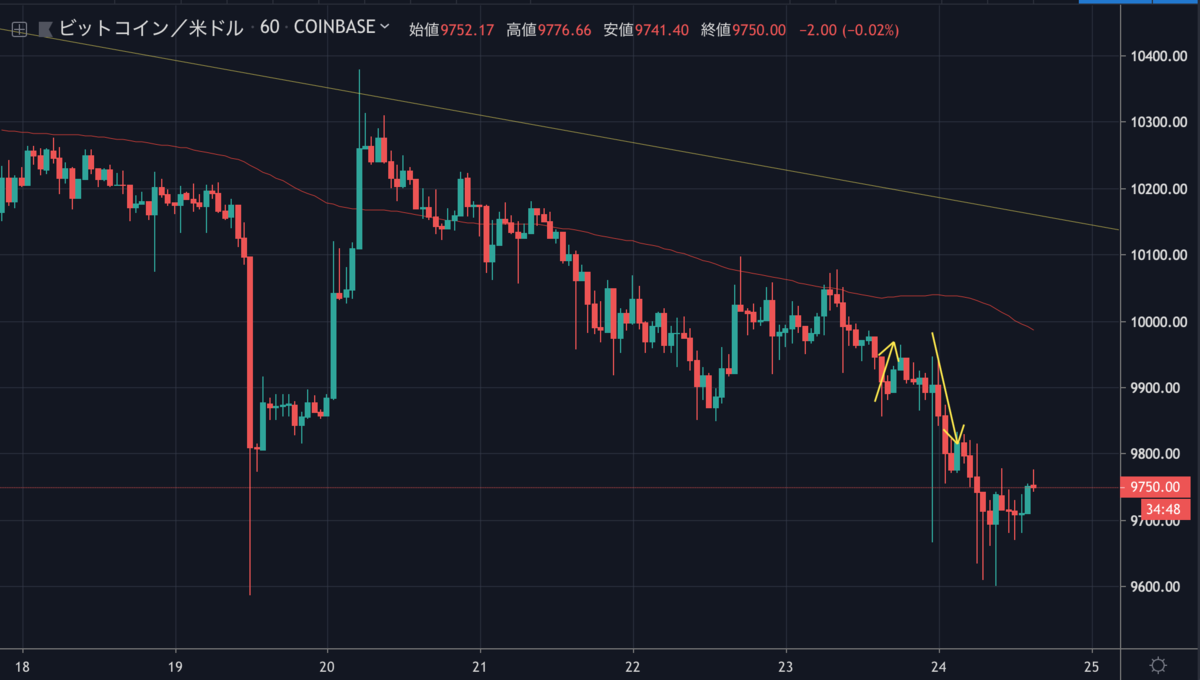
ビットコインは下落を続け、約9,600ドルの安値を付けました。
現在は9,700ドル付近で取引されています。
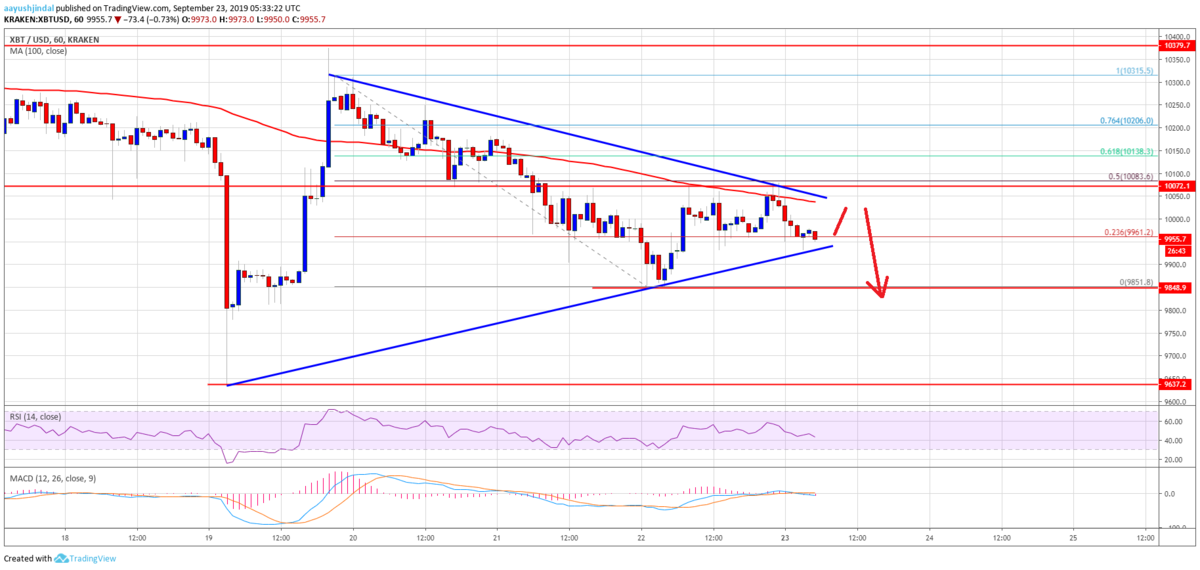
チャートは昨日のNEWS BTC先生の予想図に近いパターンを描いています。

Bitcoin Price (BTC) Watch: Here Is Why Bulls Must Be Careful

今後の値動きはどのように予想されるのでしょうか。
NEWS BTCのチャート分析を見てみます。
ビットコインのチャート分析
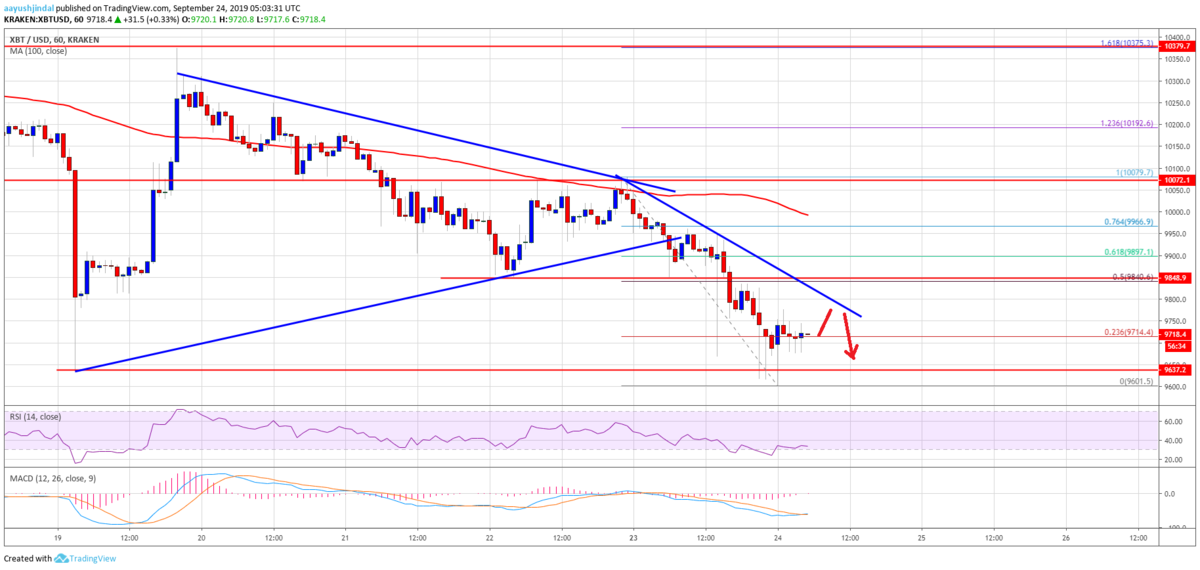
An immediate resistance is near the $9,800 level.
直近のレジスタンスは9,800ドルレベルになります。
There is also a connecting bearish trend line forming with resistance near $9,800 on the same chart. The key resistance is near the $9,850 level (the recent support).
また、同チャート上に9,800ドル付近でレジスタンスとなる下降トレンドラインも形成されています。重要なレジスタンスは、9,850ドル付近(最近のサポート)になります。

To move into a positive zone, the price must settle above $10,000 and the 100 hourly SMA. Conversely, the price might continue to move down below $9,600. The next key support is near the $9,500 and $9,400 levels, below which there are chances of another slide towards the $9,200 level.
ポジティブゾーンに入るためには、価格が10,000ドルと100時間SMA(単純移動平均線)以上で安定する必要があります。逆に言うと、9,600ドル以下まで下落を続ける可能性があります。次の重要なサポートは9,500ドルと9,400ドル付近、これを下抜けると9,200ドルに向けてさらに下落する可能性があります。
Looking at the chart, bitcoin price is showing a lot of bearish signs below $9,850 and $10,000. Therefore, there are high chances of more downsides below the $9,600 level.
チャートを見ると、ビットコインの価格は9,850ドルと10,000ドル以下で多くの弱気サインを示しています。そのため9,600ドルを下回る可能性が高いでしょう。
via: Bitcoin Price (BTC) Breakdown Looks Real, More Downsides Incoming?
_


