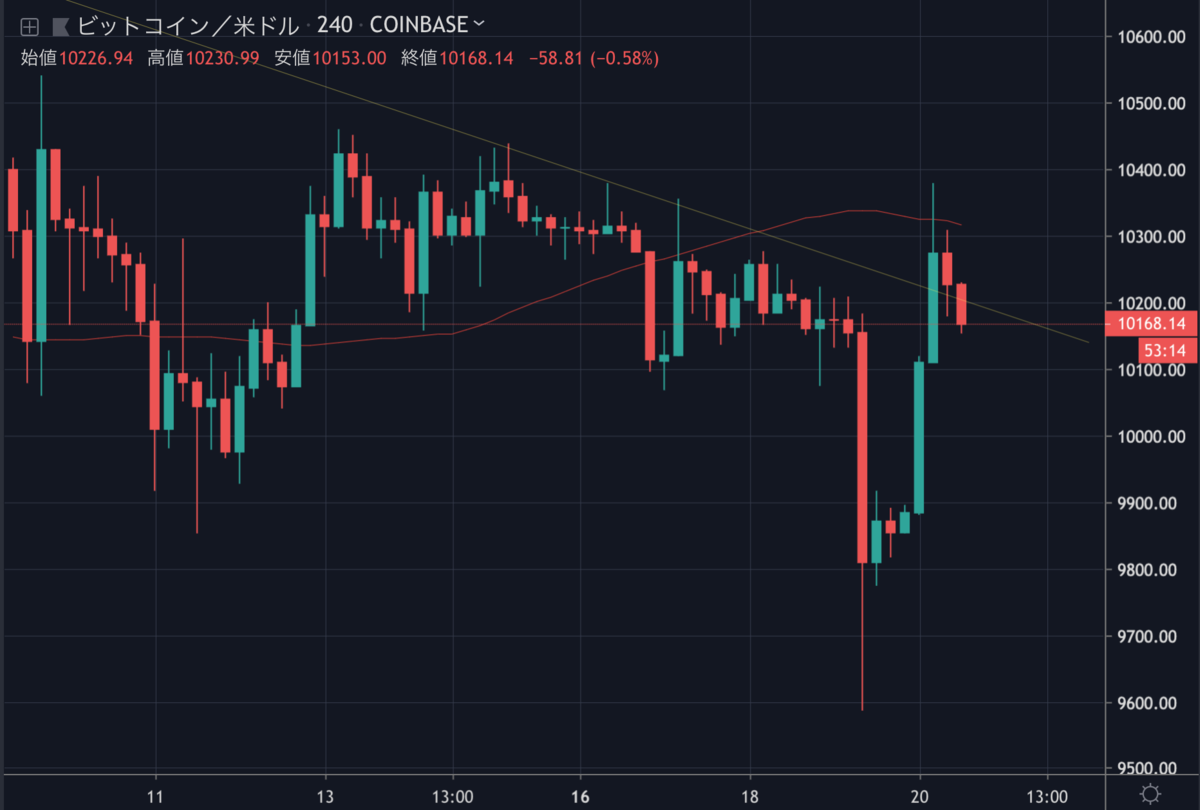
昨日のビットコインは10,000ドルを割り込んで急落し、このまま下降トレンドになるかと思いきや、反発して再び10,000ドル台まで戻りました。
現在は10,200ドル付近で取引されています。

最近は10,000ドルを割ると反発するという動きを繰り返していますが、今後の値動きはどのように予想されるのでしょうか。
NEWS BTCのチャート分析を見てみます。
ビットコインのチャート分析
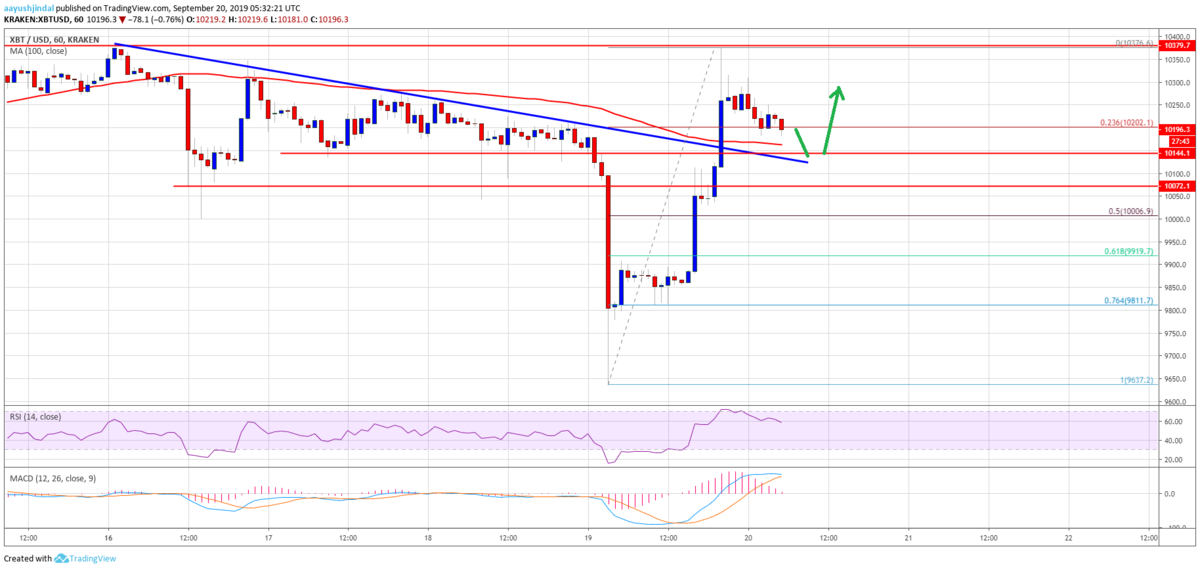
On the downside, there are many supports near the $10,150 level and the 100 hourly simple moving average. The broken trend line might also provide support near $10,150. If there are more downsides, the price could test the $10,000 support area.
下側には10,150ドルと100時間SMA付近に多くのサポートがあります。突破されたトレンドラインも10,150ドル付近でサポートとして機能するかもしれません。さらに下落する場合は、10,000ドルのサポートエリアを試す可能性があります。

On the upside, an immediate resistance is near the $10,300 level. However, the main resistance is near the $10,400 level. If there is an upside break above $10,400, the price could continue to rise towards the $10,500 and $10,800 levels.
上昇時の直近のレジスタンスは10,300ドル付近ですが、主なレジスタンスは10,400ドル付近になります。10,400ドルを上抜ければ、10,500ドルと10,800ドルレベルに向けて上昇を続ける可能性があります。
Looking at the chart, bitcoin price is back in a positive zone above the $10,000 support area. In the short term, there could be range moves above the $10,000 level before the next move.
チャートを見ると、ビットコインの価格は10,000ドルのサポートを超えポジティブゾーンに戻っています。短期的には、次の動きまでに10,000ドル以上でレンジの動きがありそうです。
via: Bitcoin Price (BTC) Rallies Sharply But Facing Significant Hurdle
_


