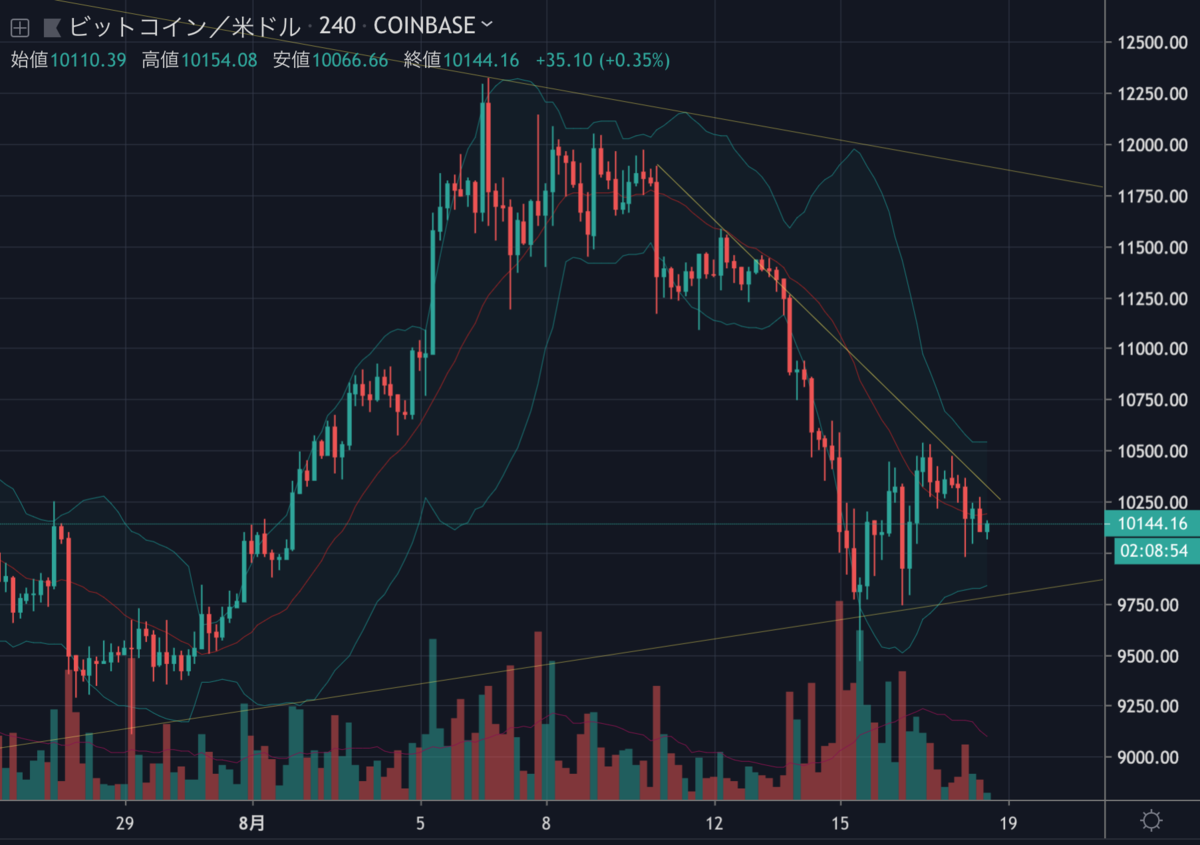
先日10,000ドルを割り込むまで下落したビットコインは、強い反発を見せる様子もなく、現在は10,100ドル付近で停滞しています。

ここから上昇トレンドに転じるには多くのレジスタンス(抵抗線)を突破する必要がありますが、ビットコインの今後の値動きはどのように予想されるのでしょうか。
NEWS BTCのチャート分析(週間予想)を見てみます。
ビットコインのチャート分析
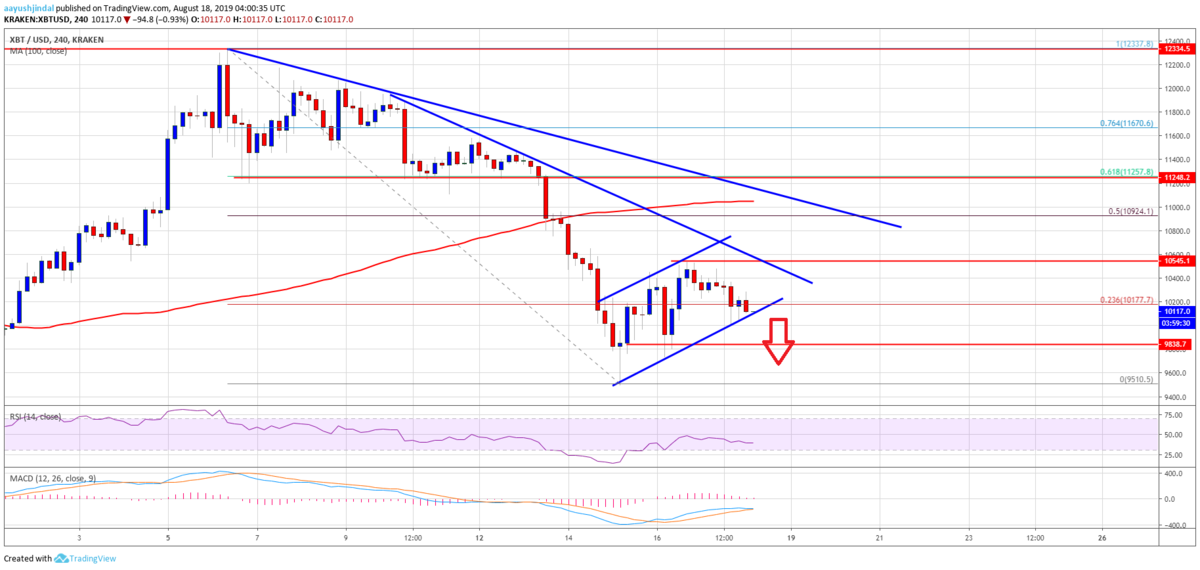
On the upside, there are many important resistances near $10,500 and $10,800. Moreover, the 50% Fib retracement level of the last major decline from the $12,337 high to $9,510 swing low is near the $10,900 level. There is also a crucial bearish trend line forming with resistance near $10,800s. Therefore, a break above the $10,500 and $10,800 resistance levels won’t be easy in the near term.
上昇する場合、10,500ドルと10,800ドル付近に多くの重要なレジスタンスがあります。さらに、直近の大きな下落(12,337ドル〜9,510ドル)の50% Fibリトレースメントレベルが10,900ドル付近にあります。また、10,800ドル付近でレジスタンスとなる下降トレンドラインも形成されています。そのため、短期的には10,500ドルと10,800ドルのレジスタンスの突破は容易ではないでしょう。

Looking at the chart, bitcoin price is clearly trading in a bearish zone below $10,500. Therefore, there is a risk of more downsides below the $10,000 and $9,800 support levels. To start a strong recovery, the price must surpass the $10,500 and $10,800 resistance levels.
チャートを見ると、ビットコインの価格は明らかに10,500ドル以下の弱気ゾーンで取引されています。そのため、さらに下落して10,000ドルと9,800ドルのサポートを割り込む危険性があります。強い回復を始めるには、10,500ドルと10,800ドルのレジスタンスを突破する必要があります。
via: Bitcoin (BTC) Price Weekly Forecast: Decline Far From Over
_


