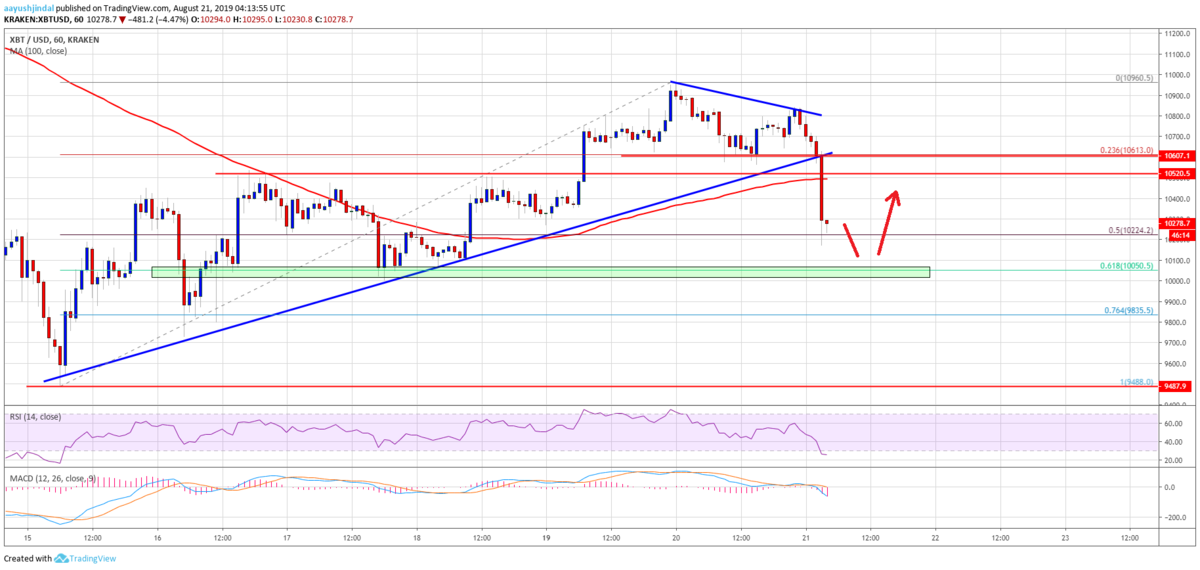
昨日のビットコインはしばらく10,700ドル付近を推移していましたが、今日突然下落を始め、記事執筆時点では10,200ドル付近で取引されています。
この下落でしばらく守られていたサポートラインが破られ、下落に転じる可能性が高くなりそうです。
一抹の不安を感じながらもNEWS BTCのチャート分析を見てみます。
ビットコインのチャート分析
An immediate support is near the $10,200 level. It coincides with the 50% Fib retracement level of the upward move from the $9,488 low to $10,960 high. If there are more downsides, the price could decline further towards the $10,000 support.
直近のサポートは10,200ドル付近。これは上昇の動き(9,488ドル〜10,960ドル)の50% Fibリトレースメントレベルと一致します。もしさらに下落すれば、価格は10,000ドルのサポートに向かう可能性があります。

If the price fails to stay above the $10,000 support, it could revisit the $9,488 swing low. Additionally, the price may even tumble below the $9,488 low and trade to a new monthly low. Conversely, if there is an upside correction, the price could test the $10,400 and $10,500 resistance levels. Additionally, the main resistance is near the $10,600 level and the 100 hourly simple moving average.
10,000ドルのサポート以上に留まることができなければ、再び9,488ドルの安値まで戻る可能性があります。さらに、9,488ドルの安値を割り込み、月間の安値を更新する可能性さえあります。逆に、もし上昇に転じた場合は、10,400ドルと10,500ドルのレジスタンスを試すでしょう。また、主なレジスタンスは10,600ドルと100時間SMA(単純移動平均線)付近になります。
Looking at the chart, bitcoin price is facing a solid rise in selling pressure below $10,500. Therefore, there is a risk of more downsides below the $10,200 support. More importantly, a successful break below the $10,000 support might start a strong downward move. The next stop for the bears could be $9,500 and $9,200 in the coming sessions.
チャートを見ると、ビットコインの価格は10,500ドル以下で売り圧力が高まっているため、さらに下落して10,200ドルのサポートを下抜ける恐れがあります。さらに重要なのは、10,000ドルのサポートを下抜けると強い下落が始まる可能性があることです。売り方の次の目標は9,500ドルと9,200ドルになるでしょう。
via: Bitcoin (BTC) Price Recent Breakdown Could Accelerate Decline
_


