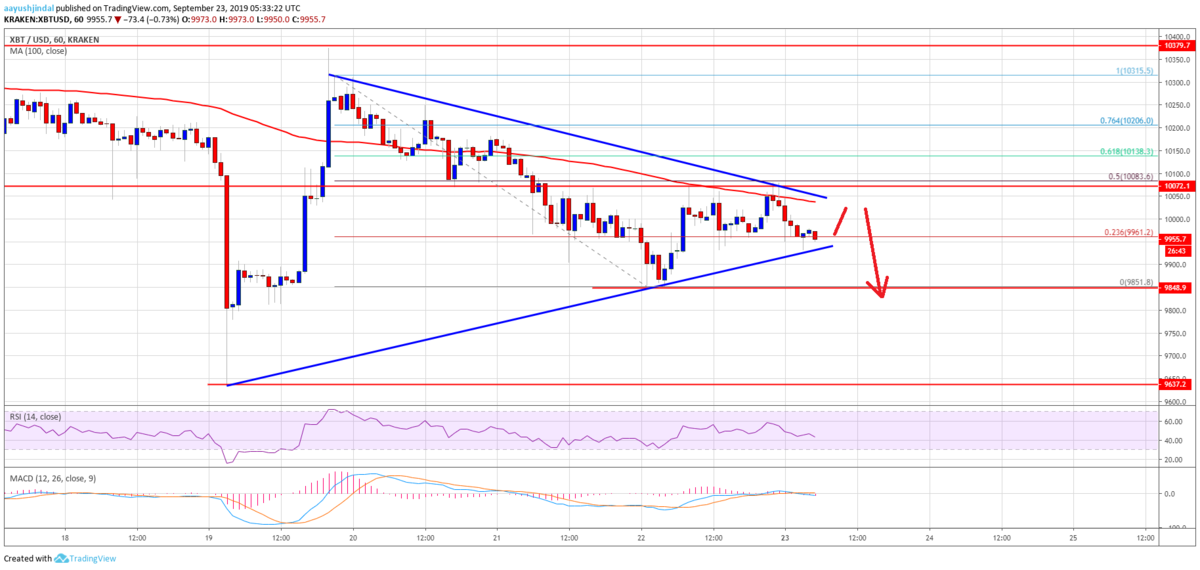
ビットコインは三角保ち合いを継続し、ここ数日は下落傾向にあります。
ここから上昇を再開するには多くのレジスタンス(抵抗線)を突破する必要がありそうですが、今後の値動きはどのように予想されるのでしょうか。
NEWS BTCのチャート分析を見てみます。
ビットコインのチャート分析
The 50% Fib retracement level of the recent decline from the $10,315 swing high to $9,851 low is also near the $10,080 level. Therefore, an upside break above the triangle and the $10,080 resistance might open the doors for a decent rise towards the $10,400 resistance area. However, a convincing break above $10,400 is must for uptrend continuation.
最近の下落(10,315ドル〜9,851ドル)の50% Fibリトレースメントレベルが10,080ドル付近にあるため、トライアングルと10,080ドルのレジスタンスを上抜けると、10,400ドルのレジスタンスエリアに向けてかなり上昇する可能性が生まれます。しかし、上昇トレンドを継続するには、10,400ドルをはっきりと上抜ける必要があります。

Conversely, the price might breakdown below the $9,900 and $9,850 levels. In the mentioned bearish case, the price could slide towards the $9,650 support area. The next key support is near the $9,400 area, below which the bears are likely to take control. They could aim the $9,000 and $8,800 levels if there is a break below $9,400.
逆に、価格が9,900ドルと9,850ドルを下抜ける可能性もあります。弱気のケースでは、価格は9,650ドルのサポートエリアに向かって下落するでしょう。次の重要なサポートは9,400ドル付近、これを下抜けると売り方が支配権を握る可能性が高くなります。9,400ドルを下抜けると、9,000ドルと8,800ドルが目標になるでしょう。
Looking at the chart, bitcoin price is clearly trading below many key resistances such as $10,080. Even if there is an upside break, the bulls face an uphill task. There is a cluster of resistances between $10,200 and $10,400. Only a daily close above $10,400 might pump the price higher towards $11,000 in the coming days.
チャートを見ると、ビットコインの価格は明らかに10,080ドルといった多くのレジスタンス以下で取引されています。たとえ上抜けたとしても先行きは厳しく、10,200〜10,400ドルの間にいくつかのレジスタンスがあります。日足が10,400ドル以上で引けた場合に限り、数日で11,000ドルに向けて上昇する可能性があります。
via: Bitcoin Price (BTC) Watch: Here Is Why Bulls Must Be Careful
_


