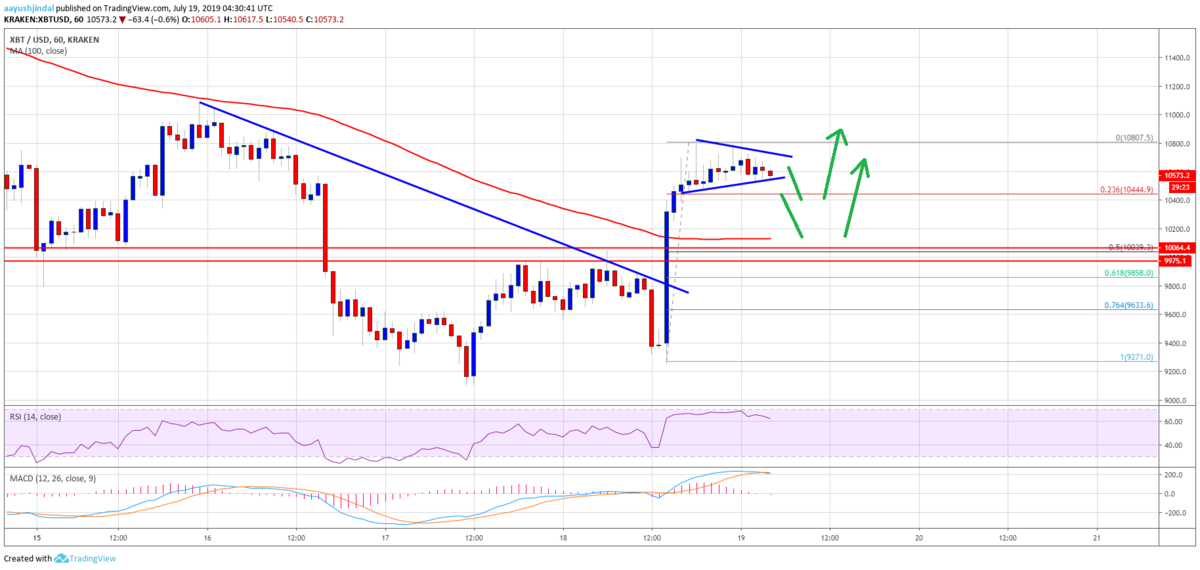
昨日9000ドル付近まで下落したビットコイン(BTC)が突然反発し、再び1万ドルを突破しました。記事執筆時点では10,500ドル付近で取引されています。
$BTC just moved +9% in 4 minutes.
— Alex Krüger (@krugermacro) 2019年7月18日
BTCが4分で9%上昇した。
Bitcoin volatility is back to levels not seen since the end of the great 2017 bull market pic.twitter.com/2CfKOOjPOo
— skew (@skew_markets) 2019年7月18日
ビットコインのボラティリティが2017年末の強気相場以来見られなかったレベルに戻った
抵抗線を上抜けたことで、今後は上昇の可能性があるのでしょうか。NEWS BTCのチャート分析を見てみます。
ビットコインのチャート分析
The BTC/USD pair traded close the $9,000 support level and formed a new monthly low near $9,095. Later, the price formed a decent support base above $9,400 and recently started an upward move. It surged more than $1,000 and broke the key $10,000 resistance.
BTC/USDペアは9,000ドルのサポートレベル付近で取引され、9,095ドル付近で月間の新安値を付けました。その後、9,400ドル以上で支持線を形成して上昇を始めました。価格は1,000ドル以上急騰、主要抵抗線の1万ドルを突破しました。
If there is a downside break, the price could test $10,440 or the 23.6% Fib retracement level of the recent wave from the $9,271 low to $10,807 high. However, the main support on the downside is near the $10,200 level and the 100 hourly simple moving average.
もし下落する場合は10,440ドルを試すか、最近の波(安値9,271ドルから高値10,807ドル)の23.6%Fibリトレースメントレベルを試す可能性があります。しかし、主なサポートは10,200ドル付近と100時間単純移動平均線になります。

Looking at the chart, bitcoin price is clearly trading in a positive zone above the $10,200 and $10,400 support levels. If there are more gains above $10,800, the price might move towards the $11,500 level in the near term.
チャートを見ると、ビットコインの価格は明らかに10,200ドルと10,400ドルのサポートレベル以上のポジティブゾーンで取引されています。もし10,800ドルを超える上昇があれば、価格は近いうちに11,500ドルに接近する可能性があります。
via: Bitcoin Price (BTC) Rallies 10%, Dips Remain Attractive To Buyers
_


