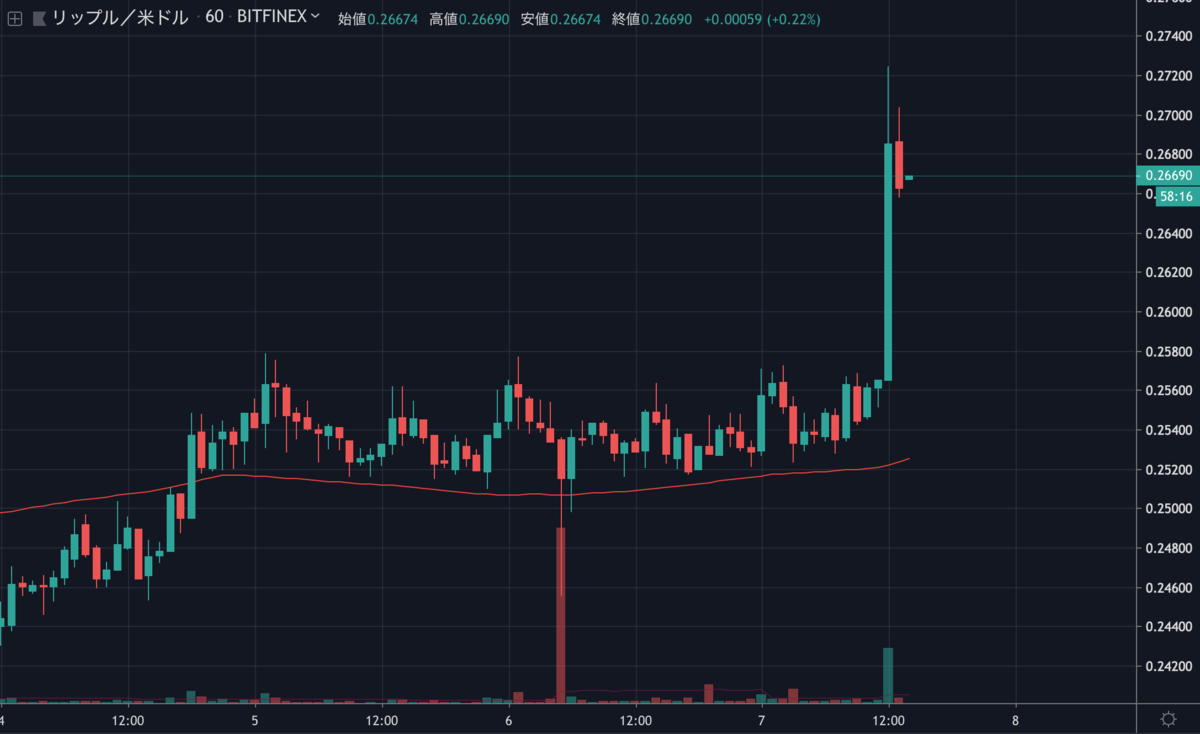
ビットコインが下落を続けている一方でリップル(XRP)が急騰しました。
わずか30分ほどで約5%上昇しています。

今後も上昇を続ける可能性はあるのでしょうか。
NEWS BTCでXRPのチャート分析を見てみます。
XRPのチャート分析
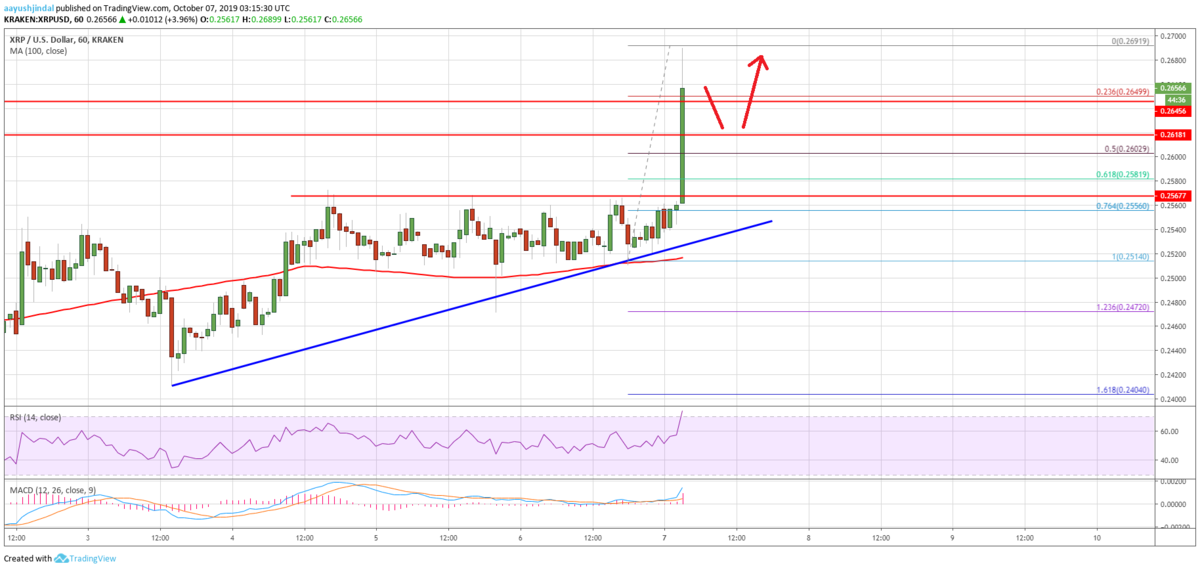
On the downside, there are many supports near the $0.2620 and $0.2600 levels. Additionally, the 50% Fib retracement level of the recent rally from the $0.2514 low to $0.2691 high is near $0.2600. More importantly, there is a connecting bullish trend line forming with support near $0.2550 on the hourly chart of the XRP/USD pair. Therefore, dips from the current levels might find bids near $0.2620 or $0.2600.
下側には0.262ドルと0.26ドル付近に多くのサポートがあります。さらに、最近の上昇(0.2514ドル〜0.2691ドル)の50% Fibリトレースメントレベルが0.26ドル付近にあります。さらに重要なのは、XRP/USDペアの時間足チャートで、0.255ドル付近でサポートとなる上昇トレンドラインが形成されていることです。そのため、現在のレベルから下落する場合は、0.262ドルまたは0.26ドル付近で買いが入る可能性があります。

The main support is near the $0.2550 level (the previous support base). On the upside, an immediate resistance is near the $0.2700 level. If there is an upside break above $0.2700, the price could test $0.2720 or even $0.2750 in the near term.
主なサポートは$0.255レベル付近(以前のサポートベース)になります。上昇時の直近のレジスタンスは0.27ドル付近です。0.27ドルを突破すれば、短期的には0.272ドルを試し、さらに0.275ドルを試す可能性さえあります。
Looking at the chart, ripple price is clearly surging with a positive bias above $0.2620. There are high chances of it extending gains above the $0.2700 and $0.2720 resistance levels in the coming sessions. Conversely, if there is a downside correction, the bulls might protect the $0.2650 and $0.2620 levels (the previous resistance levels).
チャートを見ると、リップルの価格は明らかに0.262ドルを上回りポジティブバイアスで急騰しています。今後は0.27ドルと0.272ドルのレジスタンスを超えて上昇を続ける可能性が高いでしょう。逆に、下落する場合は0.265ドルと0.262ドル(以前のレジスタンスレベル)を維持する可能性があります。
via: Ripple Price (XRP) Rallies 5% While BTC And ETH Decline
_


