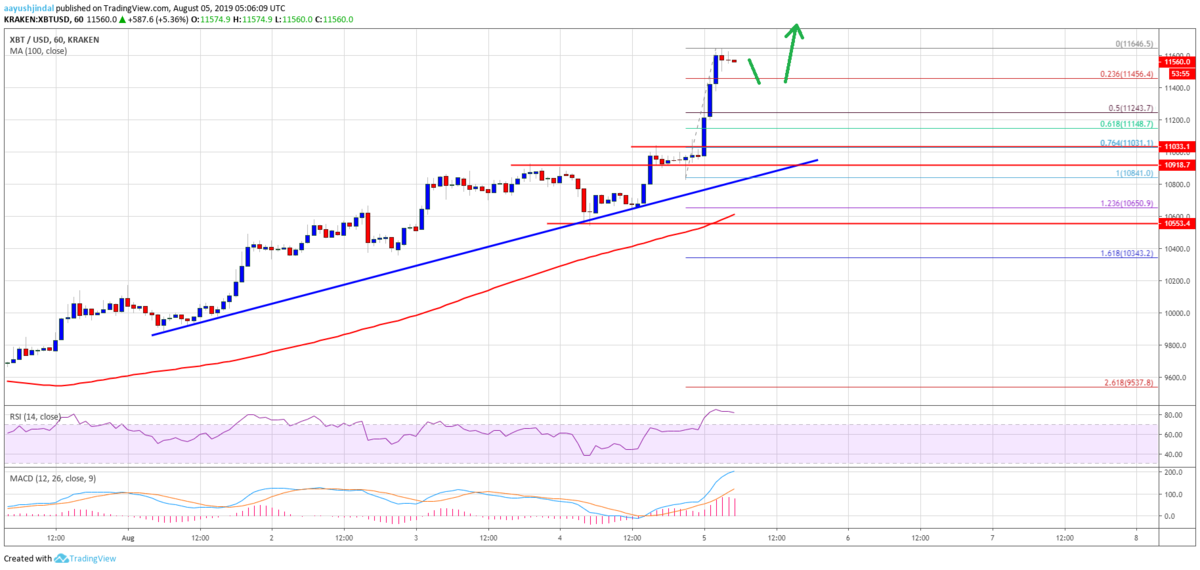
昨日10,700ドル付近で推移していたビットコインは無事に11,000ドルを突破しました。その後も強い上昇を続け、現在は11,500ドル付近で取引されています。昨日のNEWS BTCの価格予想は異常な精度で的中していました。
今日も今日とてNEWS BTCのチャート分析を見てみます。
ビットコインのチャート分析
The main support zone is near the $11,000 level, which was a resistance earlier and now it could provide support. More importantly, there is a key bullish trend line forming with support near $10,900 on the hourly chart of the BTC/USD pair.
主なサポートゾーンは11,000ドル付近、これは以前のレジスタンスですが、今はサポートとして機能する可能性があります。さらに重要なのは、BTC/USDペアの時間足チャート上に10,900ドル付近でサポートとなる上昇トレンドラインが形成されていることです。

Therefore, if there is a downside correction, the price might find strong bids near $11,250 or $11,000. On the upside, an immediate resistance is near the $11,650 swing high. A successful break above $11,650 might open the doors for a move towards the $12,000 level.
そのため、価格が下落する場合は、11,250ドルと11,000ドル付近で強い買いが入る可能性があります。上昇時は、直近のレジスタンスは11,650ドル付近になります。11,650ドルの突破に成功すれば、12,000ドルへ向けて上昇する可能性が生まれます。
Looking at the chart, bitcoin price is showing a lot of positive signs above the $11,200 and $11,500 levels. The price action suggests that there could be a short term downside correction before more gains above the $11,650 level.
チャートを見ると、ビットコインの価格は11,200と11,500ドル以上で多くのポジティブサインを示しています。この値動きは、これから短期的な調整の後に11,650ドルを超える上昇が続く可能性を示唆しています。
via: Bitcoin Price Hits $11.5K Target: BTC Up 8%, Dips Well Supported
_


