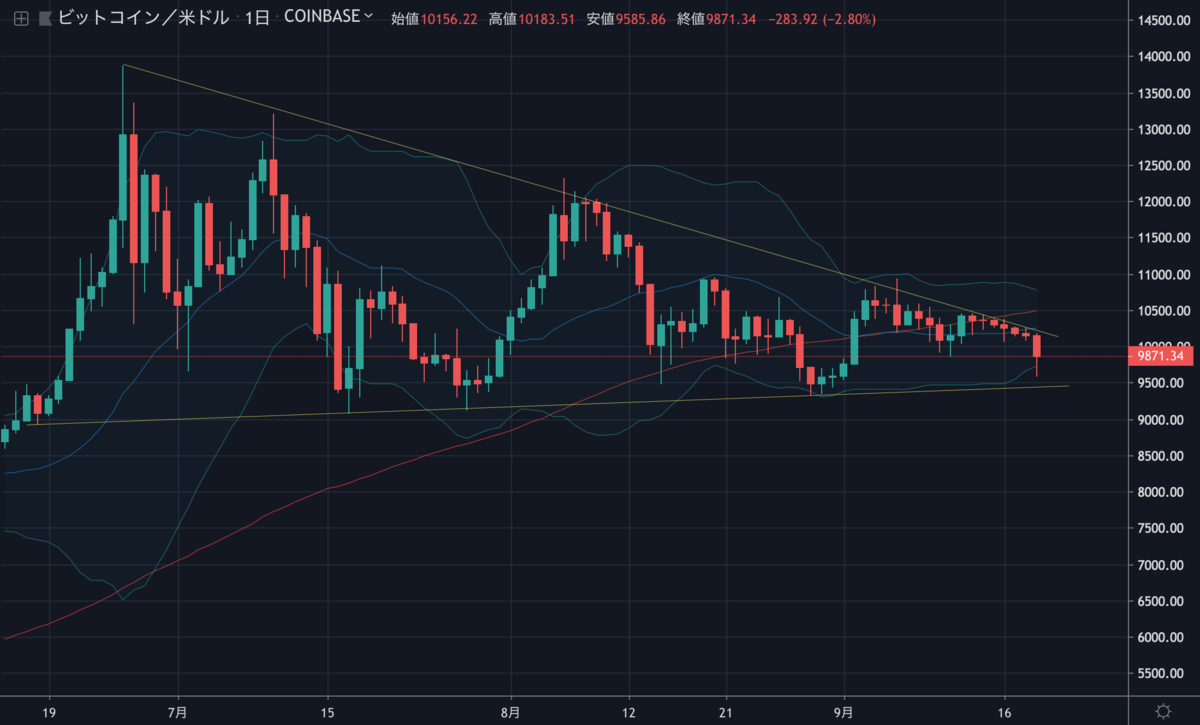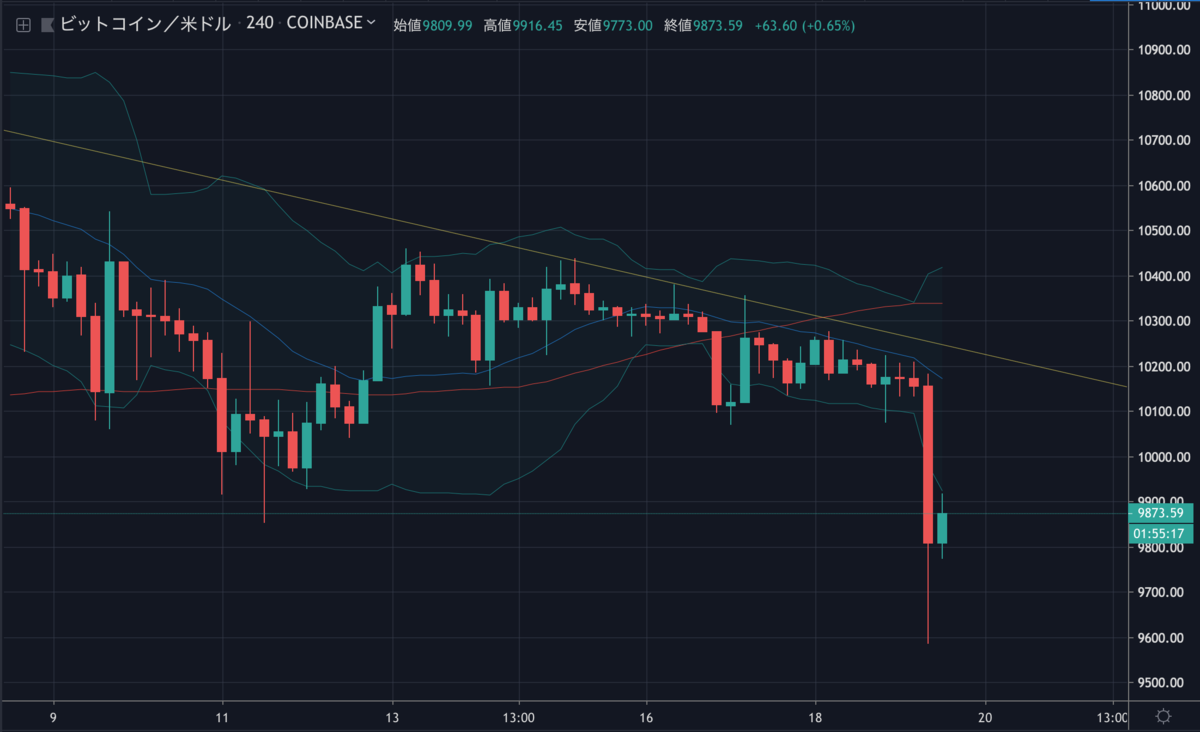
昨日まで小さな値動きを続けていたビットコインは、今日の昼頃に急落し、10,000ドルを割り込みました。日足チャートではまだ大きな三角保ち合いを形成しています。


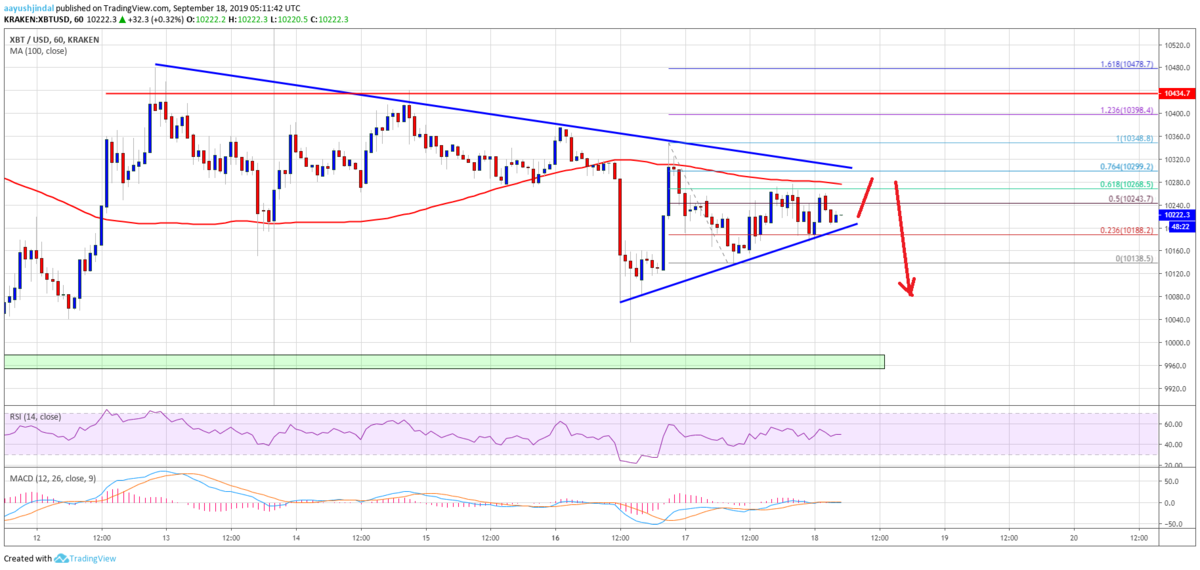
今回の下落は昨日のNEWS BTCの予想通りですが、今後の値動きはどのように予想されるのでしょうか。

Bitcoin Price (BTC) Trading Near Make-or-Break Levels
ビットコインのチャート分析
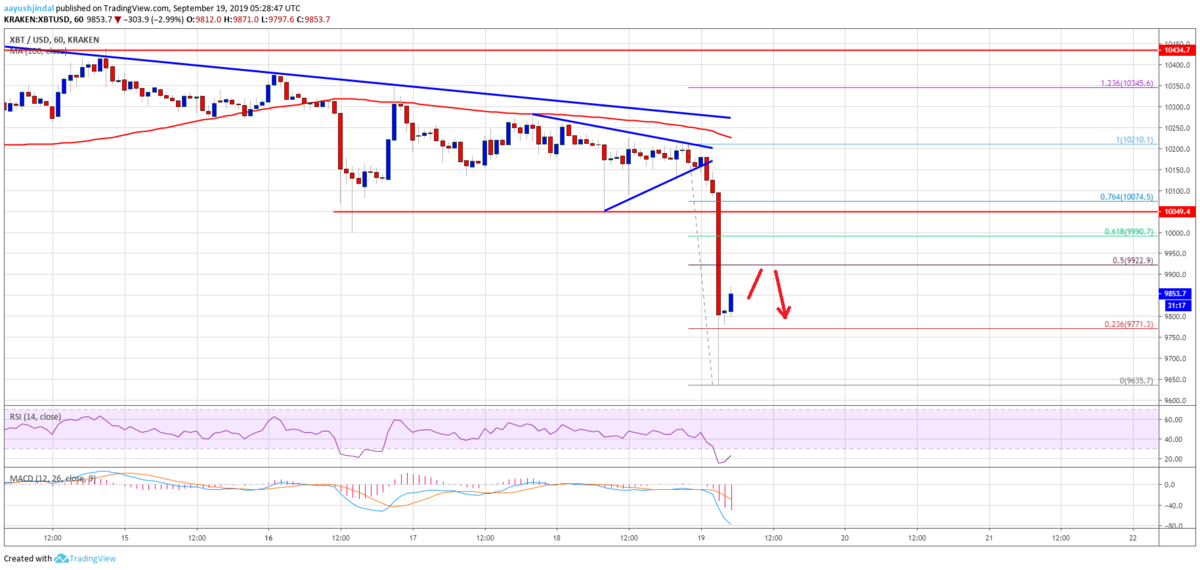
An immediate resistance on the upside is near the $9,900 and $9,925 levels.
上昇時の直近のレジスタンスは9,900ドルと9,925ドル付近になります。

However, the main resistance is near the $10,000 and $10,050 levels (the previous support levels). Therefore, an upside correction towards the $10,000 level might face a strong resistance.
しかし主なレジスタンスは10,000ドルと10,050ドル付近(前回のサポートレベル)です。そのため、10,000ドルに向かう上方修正は強いレジスタンスに遮られる可能性があります。
On the downside, an immediate support is near the $9,750 level. If there are more downside, the price could even break the recent low at $9,635. The next key support area is near the $9,550 and $9,500 levels, below which the bulls might struggle to protect strong declines.
下落する場合の直近のサポートは9,750ドル付近。これを下抜けると、最近の安値9,635ドルをブレイクする可能性もあります。次の重要なサポートエリアは9,550ドルと9,500ドル付近、これを下抜けると強い下落に苦戦しそうです。
Looking at the chart, bitcoin price is currently in a bearish zone below the $10,000 level. In the short term, there could be an upside correction, but the $10,000 area could stop the recovery. On the downside, the main supports for the current decline is near the $9,600 and $9,500 levels, where the bulls may take a stand.
チャートを見ると、ビットコインの価格は現在10,000ドル以下の弱気ゾーンにあります。短期的には反発して上昇する可能性もありますが、10,000ドルエリアで上昇が止まりそうです。下落する場合は、主なサポートは9,600ドルと9,500ドル付近、ここで買いが入るかもしれません。
via: Bitcoin Price (BTC) Breaks Down, Turns Sell On Rallies
_


