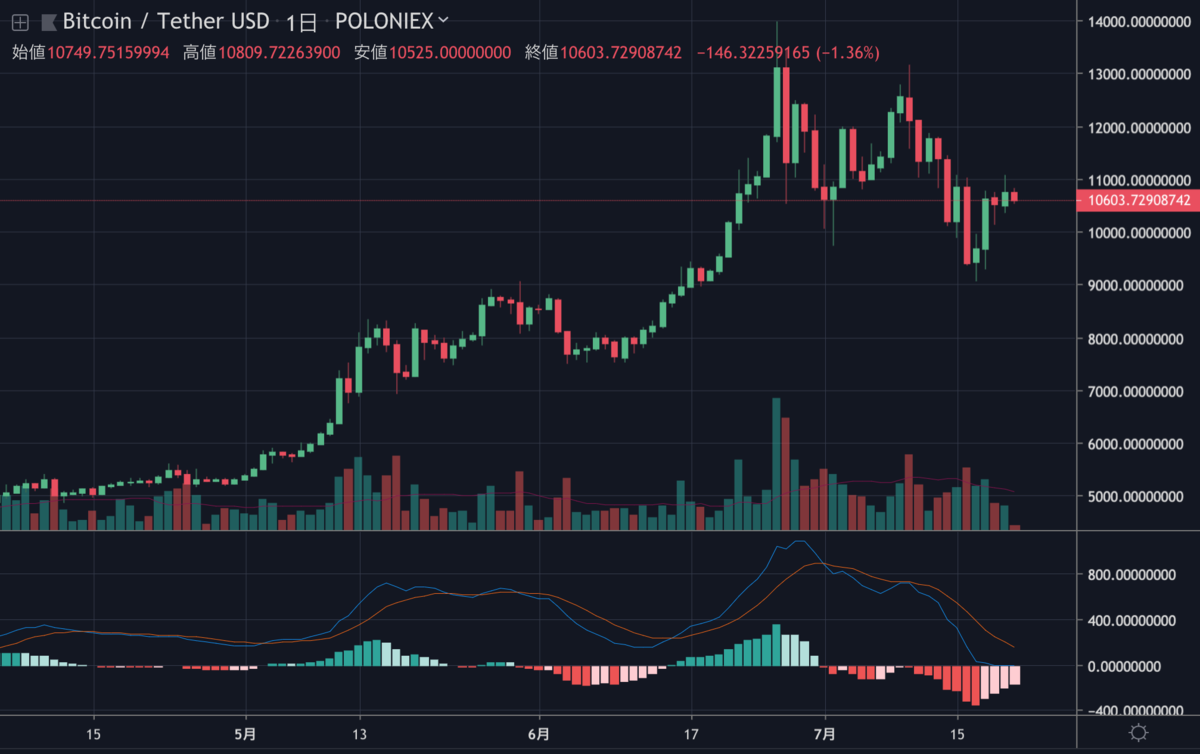
著名アナリストJoe MacCann氏は、ビットコイン(BTC)の日足チャートでMACDのゴールデンクロスが間近に迫っていることを指摘しています。
過去二回のクロスでは、その後数週間でBTCの価格が約60%上昇しました。
MACD Crossover soon come.
— Joe McCann (@joemccann) 2019年7月20日
Then...fireworks.#bitcoin pic.twitter.com/ISWHZbqNOt
MACDの強気シグナル迫る
As noted by prominent analyst Joe McCann, the one-day Moving Average Convergence Divergence (MACD), an indicator meant to determine momentum and trends, is about to see a bullish crossover on Bitcoin’s one-day chart.
著名アナリストJoe MacCann氏が指摘するように、ビットコインの日足チャートで、MACD(モメンタムとトレンドを表す指標)の強気クロスオーバーが間近に迫っています。
MACD Crossover soon come.
— Joe McCann (@joemccann) 2019年7月20日
Then...fireworks.#bitcoin pic.twitter.com/ISWHZbqNOt
MACDクロスオーバーが迫っている。
そうしたら花火だ。
そうしたら花火だ。
As McCann points out in the chart above, the last two times that the one-day Bitcoin chart saw this series of events come to fruition, BTC rallied by 60% in a week or two after those two bullish instances.
上のチャートでMcCann氏が指摘するように、ビットコインの日足チャートがこれを実現した過去二回では、BTCの価格が一、二週間後に60%上昇しました。
Should BTC rally 60% from current levels, it would reach a price point of $17,000 — just shy of Bitcoin’s zany all-time high of $20,000.
もしBTCが現在の水準から60%上昇すれば、価格は17,000ドルに届きます。これは、ビットコインの史上最高値2万ドルをわずかに下回る程度の価格です。
via: Bitcoin: Signal That Preceded Two 60% BTC Rallies is Forming
_


