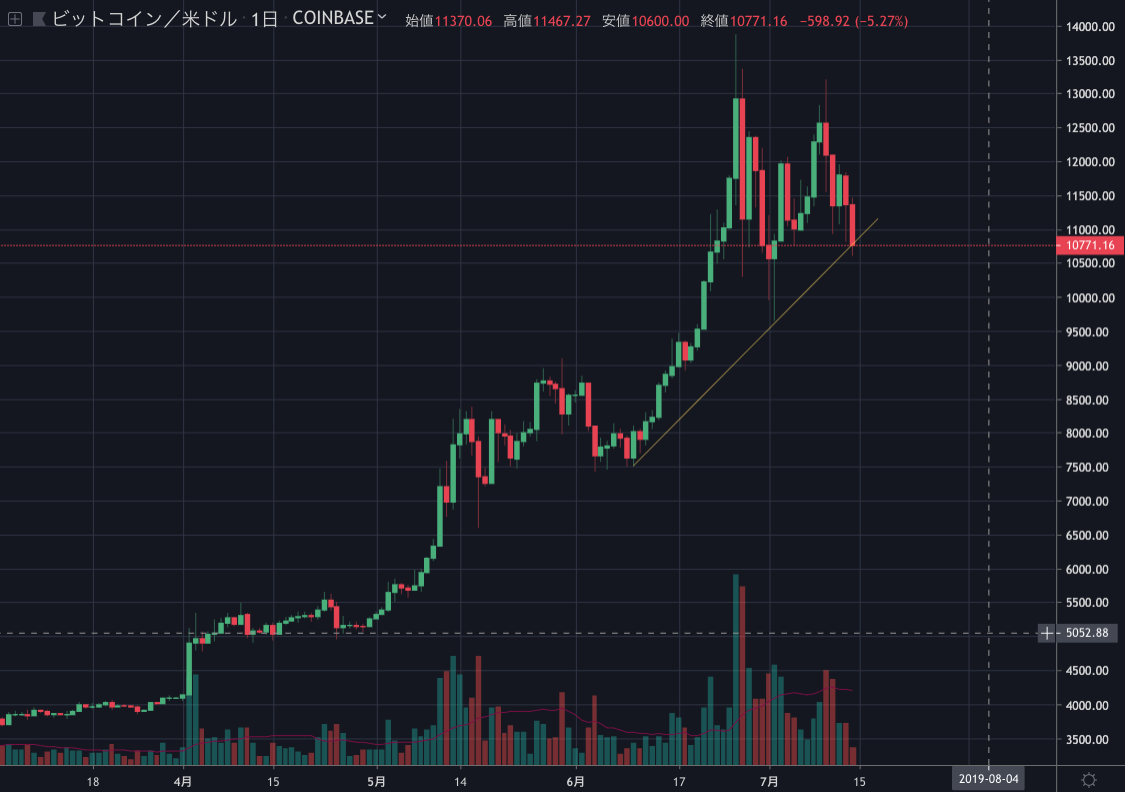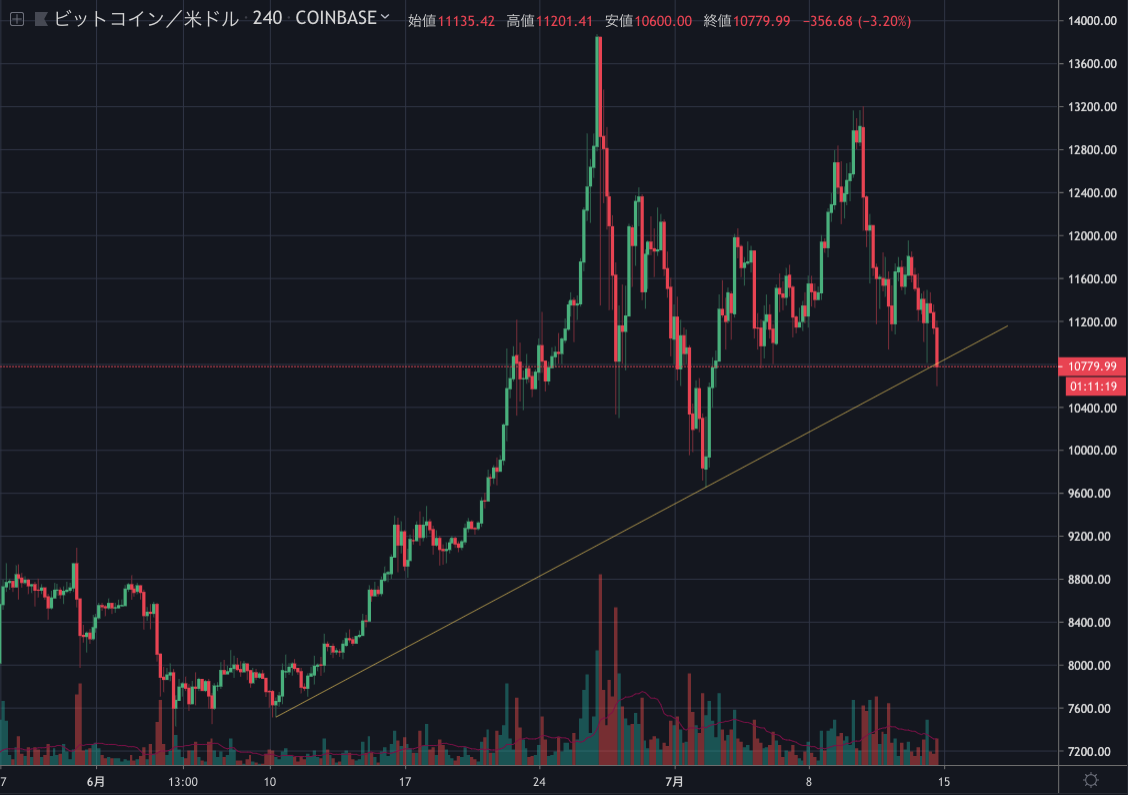
ビットコインは今日も大きく下落し、現在は1万800ドル付近で取引されています。


先日のCCNの記事でもビットコインは9000ドルまで下落すると予想されていましたが、このまま下落を続けるのでしょうか? NEWS BTCのチャート分析を見てみます。
ビットコインのチャート分析
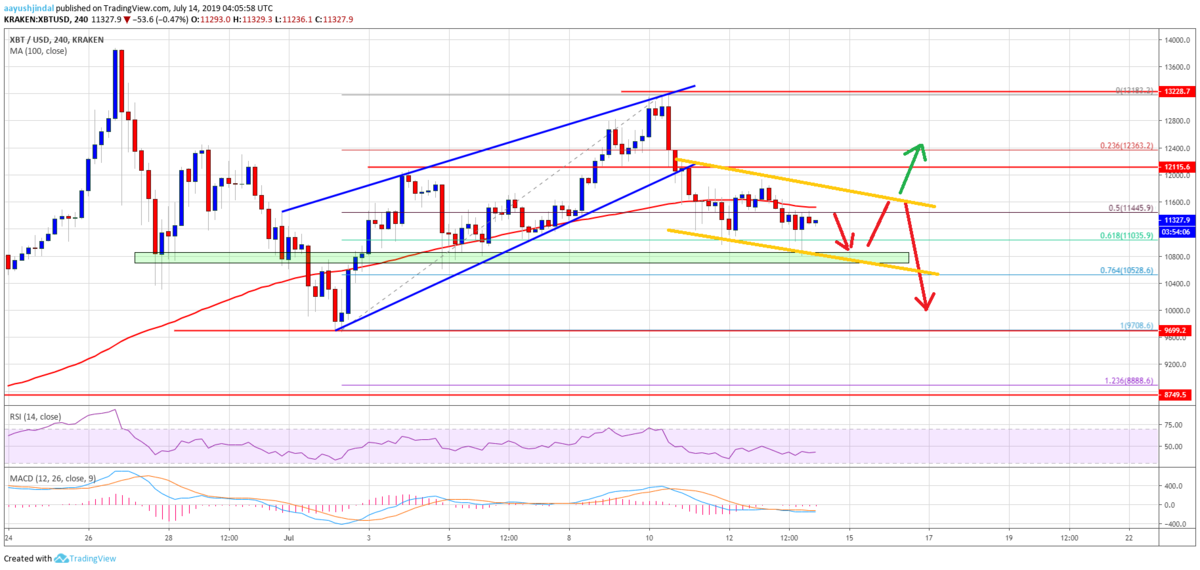
If there is a successful close above $12,000, the price could start a fresh increase towards the $12,400 and $12,500 levels. Conversely, if the bulls fail near $11,500 or $12,000, there could be another dip.
12,000ドル以上で首尾良く引ける場合、12,400ドルと12,500ドル付近に向けて新たな上昇が始まる可能性があります。逆に、上昇が11,500ドルか12,000ドル付近で止まった場合、再び下落する可能性があります。
More importantly, there is a risk of a downside break below the key $10,800 support area. In the mentioned case, the price could test the $8,880 support area. It represents the 1.236 Fib extension level of the upward move from the $9,708 low to $13,182 swing high.
さらに重要なのは、主要な10,800ドルのサポートエリアを下回るリスクがあることです。その場合、価格は8,880ドルのサポートエリアを試す可能性があります。これは安値9,708ドルから高値13,182ドルまでの上昇の1.236%Fibエクステンションレベルを示しています。

Looking at the chart, bitcoin price is clearly struggling to rebound above $12,000 and it could extend losses towards the $8,880 level if there is a successful break below $10,800.
チャートを見ると、ビットコインの価格は明らかに12,000ドルを超えるほどの反発はなく、10,800ドルを下回れば8,880ドル付近まで下落する可能性があります。
via: Bitcoin (BTC) Price Weekly Forecast: Risk of Extended Drop To $8,880
_


