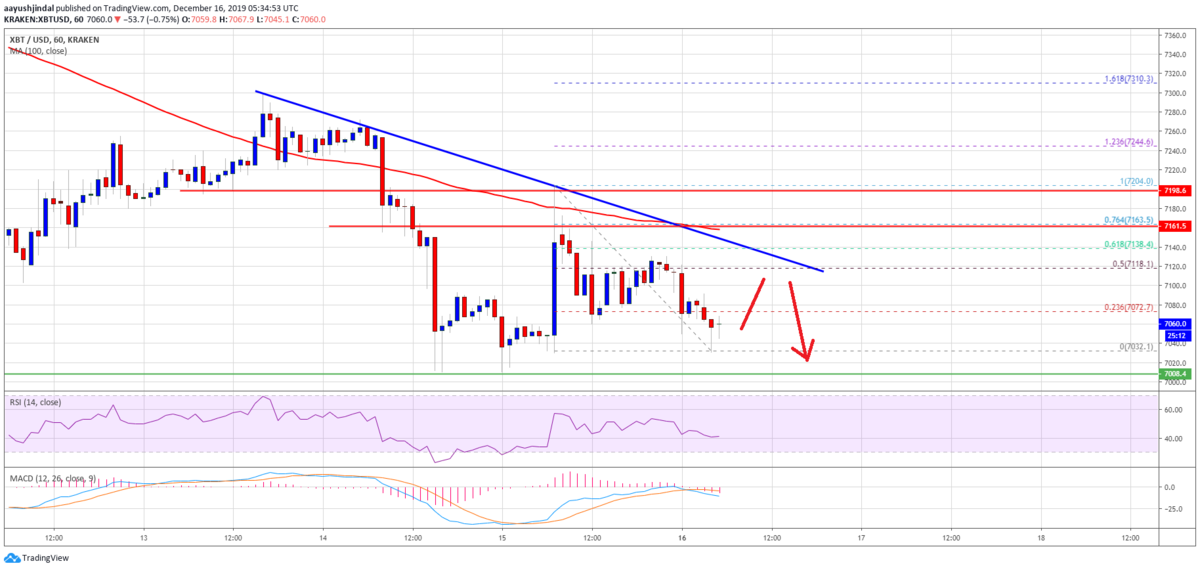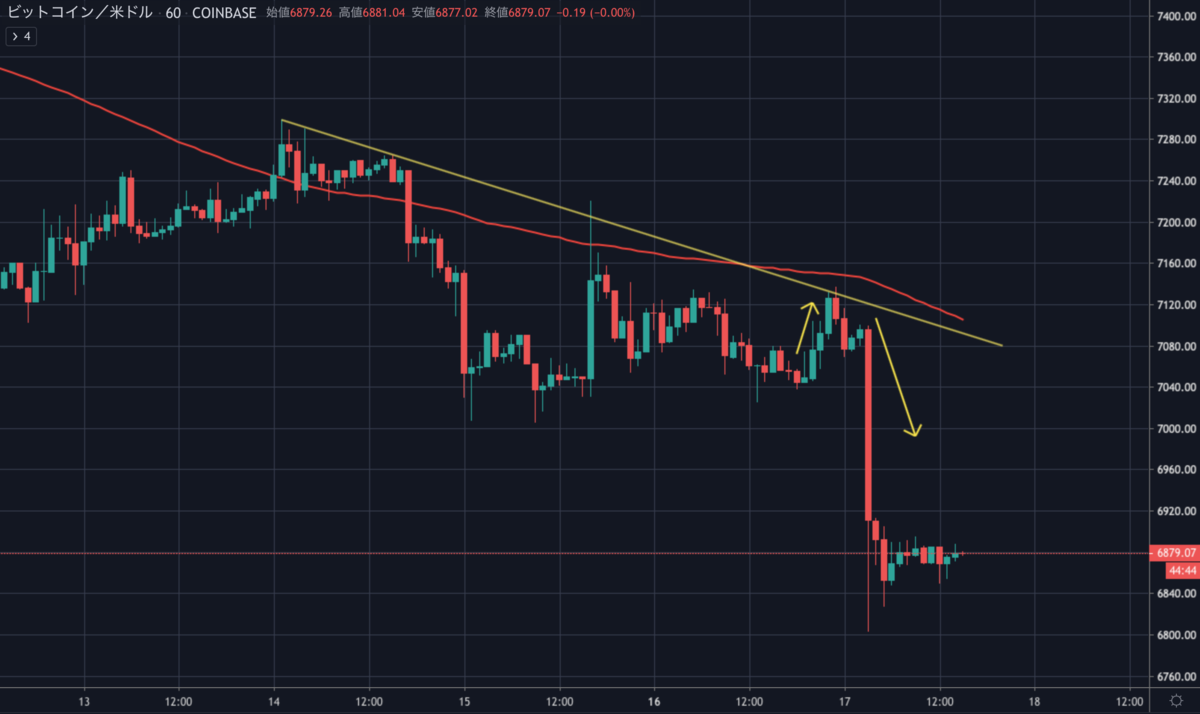
7,100ドル付近でもみ合っていたビットコインはさらに下落し、7,000ドルを割り込みました。現在は6,800ドル付近で取引されています。
昨日のNEWS BTCの予想はまたしても的中でした。再びショート無双になりそうです。

Bitcoin (BTC) Breakdown Below $7K Looms, Can Bulls Bounce Back?

年末で手仕舞いする人が増え、ここからさらに下落するのでしょうか。
NEWS BTCでビットコインのチャート分析を見てみます。
ビットコインのチャート分析
An immediate resistance is near the $6,880 level. Besides, the 23.6% Fib retracement level of the recent downward move from the $7,135 high to $6,800 low is also near the $6,880 area.
最初のレジスタンスは6,880ドル付近になります。また、最近の下落(7,135ドル〜6,800ドル)の23.6% Fibリトレースメントレベルも6,880ドル付近にあります。

More importantly, there is a short term contracting triangle forming with resistance near $6,880 on the hourly chart of the BTC/USD pair. Therefore, an upside break above $6,880 level might start a short term upside correction.
さらに重要なのは、BTC/USDペアの時間足チャートに、6,880ドル付近でレジスタンスとなる短期的な三角保ち合いが形成されていることです。そのため、6,880ドルを上抜ければ、短期的な回復が始まる可能性があります。
Conversely, the price is likely to accelerate lower below the $6,840 and $6,820 levels. If bitcoin breaks the $6,800 low, the next stop for the bears could be near $6,600 or $6,500.
逆に、下落が加速し、6,840ドルと6,820ドルを下回る可能性も高いでしょう。。もしビットコインが安値の6,800ドルを下抜けると、売り方の次の目標は6,600ドルか6,500ドル付近になるでしょう。
Looking at the chart, bitcoin price is sliding heavily below $7,000 and $6,880. Thus, there are high chances of more downsides as long as the price is trading below the $7,000 and $7,015 resistance levels in the near term.
チャートを見ると、ビットコインの価格は7,000ドルと6,880ドルを大きく下回っています。そのため、7,000ドルと7,015ドルのレジスタンス以下で取引されている限り、短期的にさらに下落する可能性が高くなります。
via: Bitcoin Breakdown Looks Real, $6.2K On The Horizon?
_


