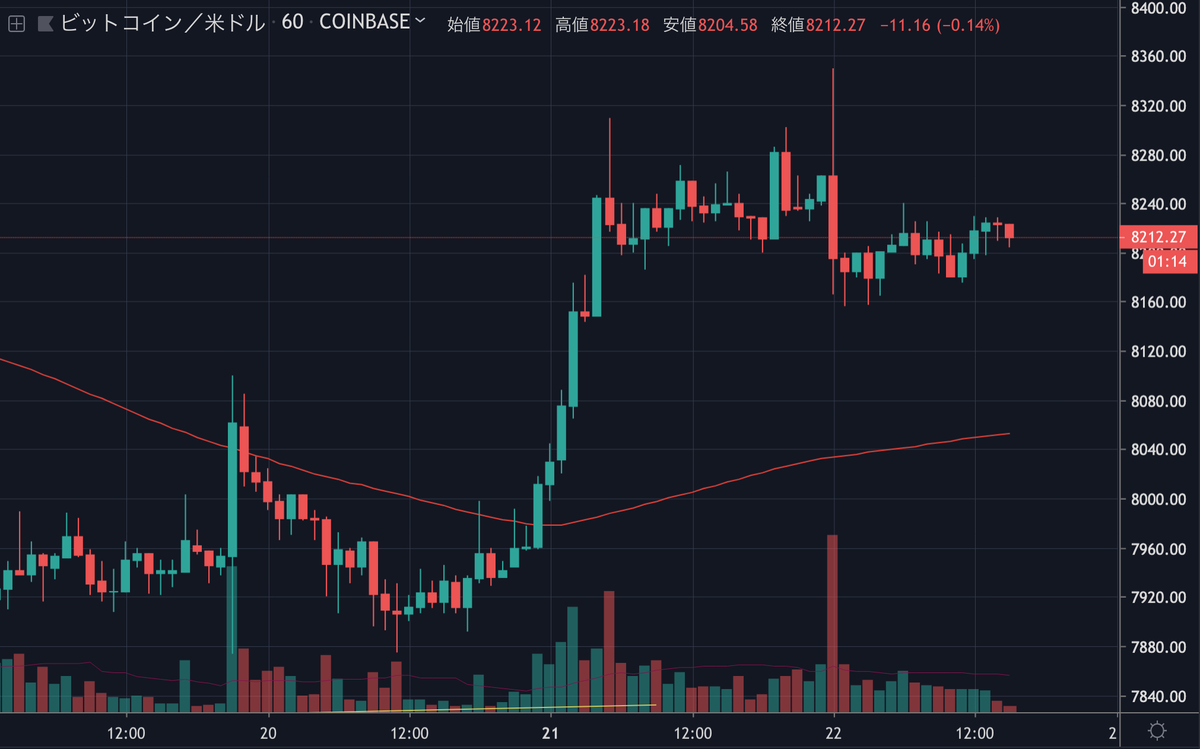
先日急騰したビットコインは、その後大きな動きを見せず、現在も8,200ドル付近で取引されています。

このまま再び急落して典型的なシンプソン相場になるかもしれませんが、今後の値動きはどのように予想されるのでしょうか。
NEWS BTCでビットコインのチャート分析を見てます。
ビットコインのチャート分析
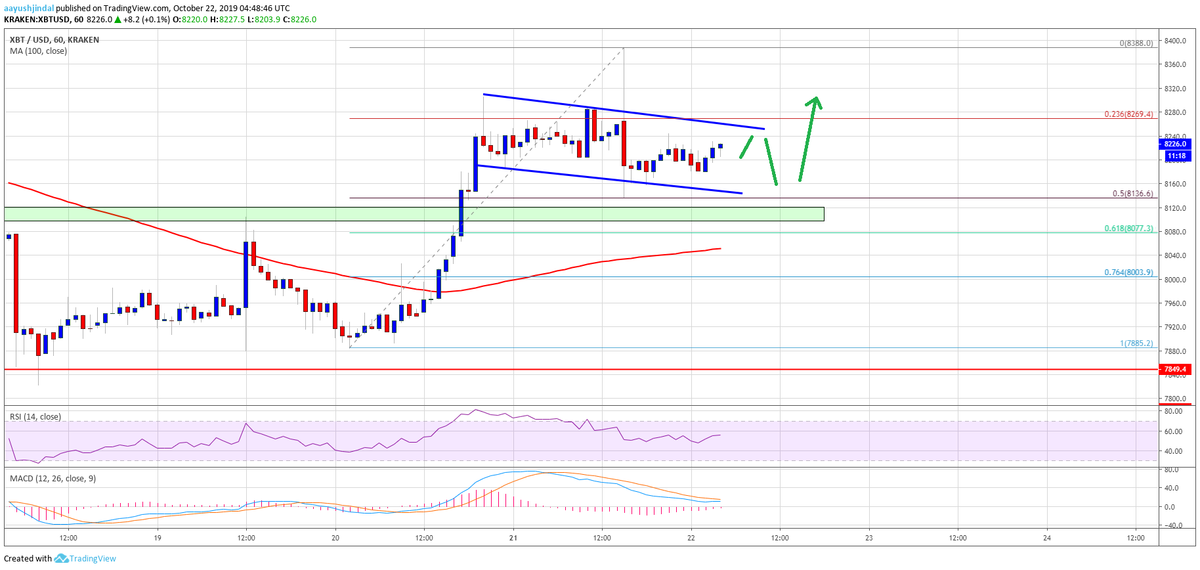
On the upside, an immediate resistance is near the $8,260 and $8,280 levels. The main resistance is near the $8,300 level, above which the price could climb steadily towards the $8,400 resistance area.
上昇する場合の直近のレジスタンスは8,260ドルと8,280ドル付近になります。メインレジスタンスは8,300ドル付近で、これを超えると8,400ドルのレジスタンスエリアに向かって堅実に上昇する可能性があります。

Should there be an upside break above $8,400, the price may perhaps test the weekly resistance area near $8,500. On the downside, the $8,150 and $8,100 levels are important. If there is a bearish break below the $8,100 support, the price could test the $8,050 level and the 100 hourly SMA.
もし8,400ドルを突破すれば、おそらく8,500ドル付近にある週足のレジスタンスエリアを試すことになりそうです。下落する場合、8,150ドルと8,100ドル付近が重要になります。8,100ドルのサポートを下抜ける場合、価格は8,050ドルと100時間SMA(単純移動平均線)を試す可能性があります。
Looking at the chart, bitcoin is showing a few positive signs above the $8,100 and $8,150 levels. Having said that, a successful close above $8,300 is must for the bulls to gain momentum. If they gain traction, there are high chances of a decent wave towards the $8,500 resistance.
チャートを見ると、ビットコインは8,100ドルと8,150ドル以上でいくつかのポジティブサインを示しています。とはいえ、上昇の勢いを増すには8,300ドル以上でうまく引ける必要があります。勢いが付けば、8,500ドルのレジスタンスに向けて堅実に上昇する可能性が高いでしょう。
via: Bitcoin (BTC) Price Eyeing Another Leg Higher To $8,500
_


