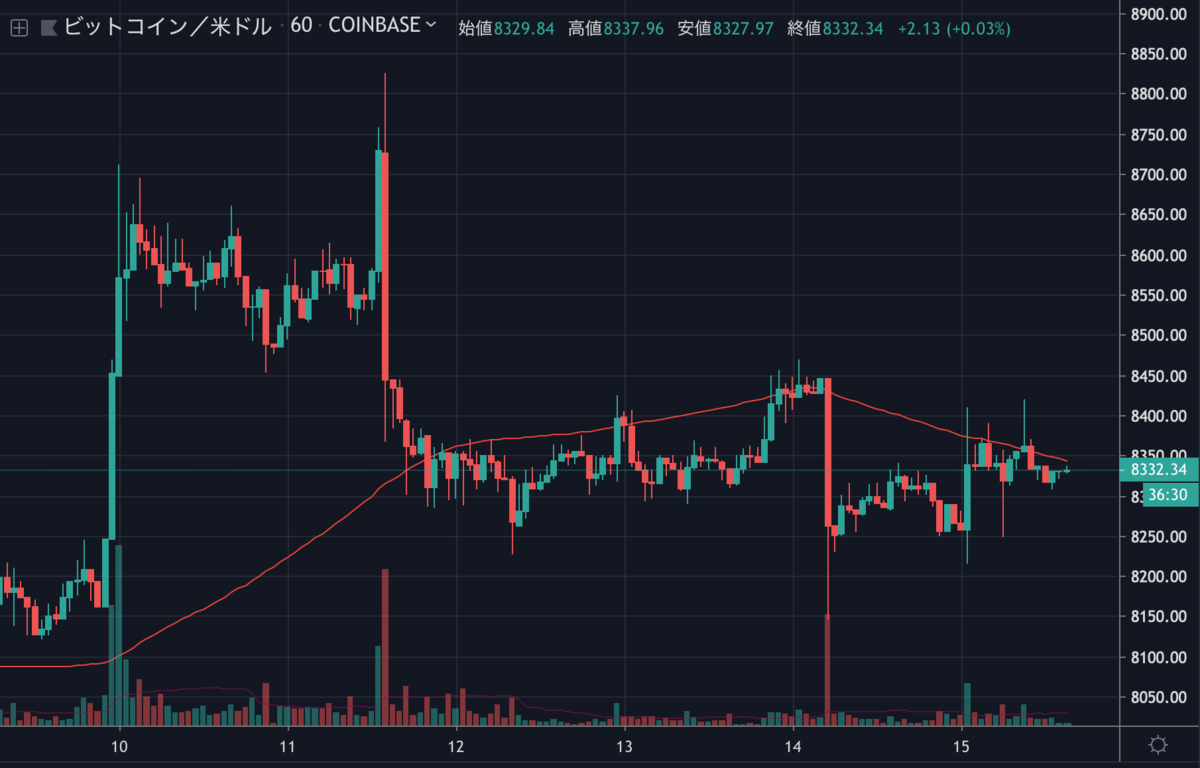
先日の急騰・急落以降、ビットコインは上昇できずに苦戦を続けています。

一方でリップル(XRP)は順調に上昇しており、今日はイーサリアム(ETH)も188ドル付近まで上昇しました。
資金がビットコインからアルトコインに流れている可能性もありますが、今後の値動きはどのように予想されるのでしょうか。
NEWS BTCでビットコインのチャート分析を見てみます。
ビットコインのチャート分析
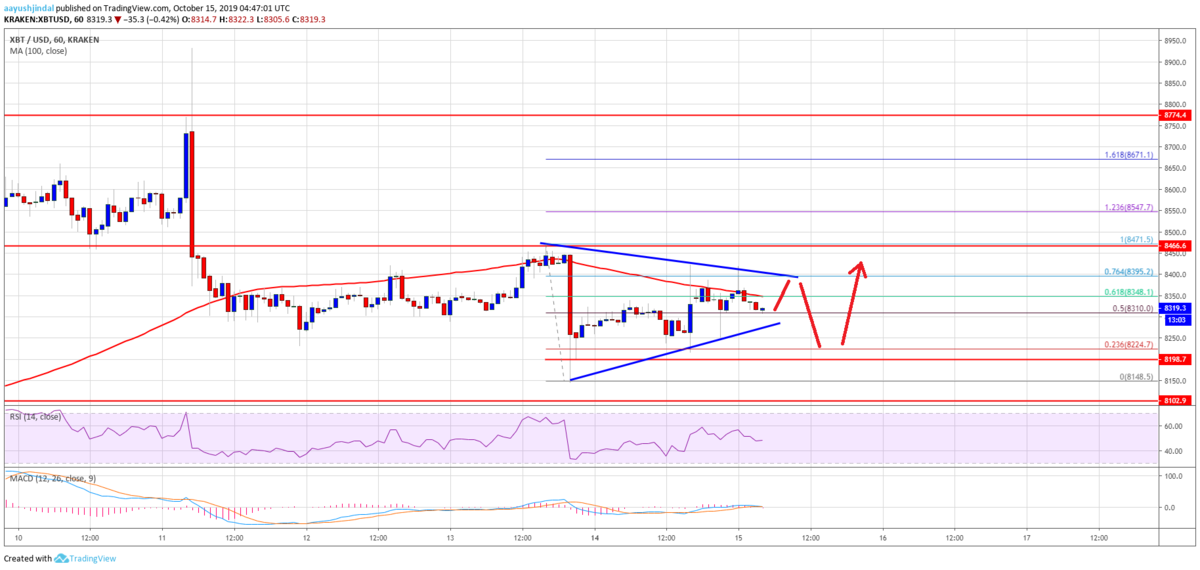
At the moment, the price is trading in a range below the $8,400 resistance area. Additionally, there is a new breakout pattern forming with resistance near $8,400 on the hourly chart of the BTC/USD pair. Above the triangle resistance, bitcoin price could face resistance near the $8,460 level. A successful close above $8,460 and a follow through above the $8,500 resistance might set the pace for a fresh increase in the near term.
現在は8,400ドルのレジスタンスエリアを下回りレンジ内で取引されています。また、BTC/USDペアの時間足チャートでは、8,400ドル付近でレジスタンスとなるブレイクアウトパターンが新しく形成されています。トライアングルのレジスタンスを超えると、ビットコインの価格は8,460ドル付近のレジスタンスに直面するでしょう。8,460ドル以上で引け、8,500ドルのレジスタンス以上まで上昇すれば、近いうちにさらに上昇のペースを上げる可能性があります。

On the downside, the triangle support is near the $8,280 level. If there is a downside break, the price could retest the main $8,200 support area. Should there be a daily close below the $8,200 support, the price may perhaps continue to slide towards the $8,000 and $7,800 support levels.
下落する場合、トライアングルのサポートが8,280ドル付近にあります。これを下抜けると、価格は8,200ドルのメインサポートエリアを再び試す可能性があります。8,200ドル以下で日足が引けると、8,000ドルと7,800ドルのサポートレベルに向けて下落を続けるでしょう。
Looking at the chart, bitcoin seems to be setting up for the next break. There are high chances of a decent rebound above $8,400 as long as there is no daily close below $8,200.
チャートを見ると、ビットコインは次のブレイクに備えているように見えます。8,200ドル以下で引けない限り、8,400ドル以上までしっかり反発する可能性は高いでしょう。
via: Bitcoin (BTC) Price Hesitates But Fresh Rebound Seems Likely
_


