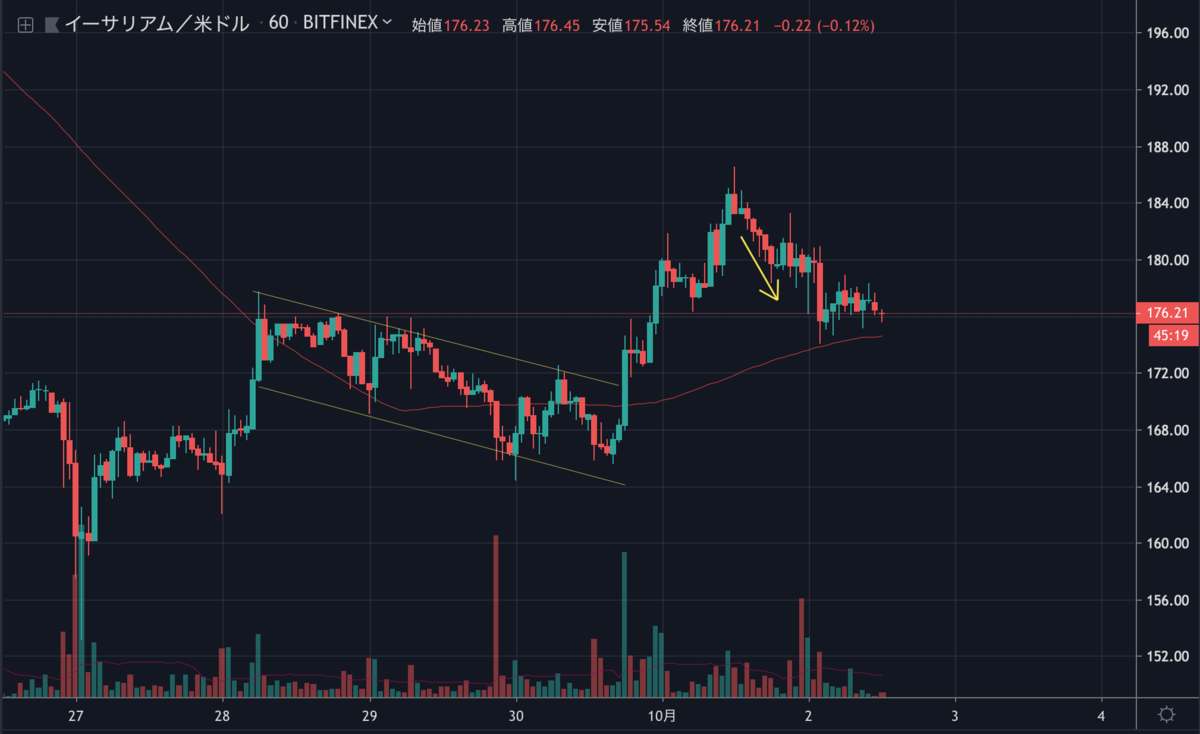
昨日のイーサリアムは上昇を続けることができず、現在は176ドル付近で取引されています。
NEWS BTC先輩の昨日の予想は残念ながら不調でした。

Ethereum (ETH) Price Rebound Reaching Crucial Juncture

しかし、時間足チャートの100SMAでサポートされ、下落は止まっています。このまま粘ってくれることに期待したいところですが、今後の値動きはどのように予想されるのでしょうか。
イーサリアムのチャート分析を見てみます。
イーサリアムのチャート分析
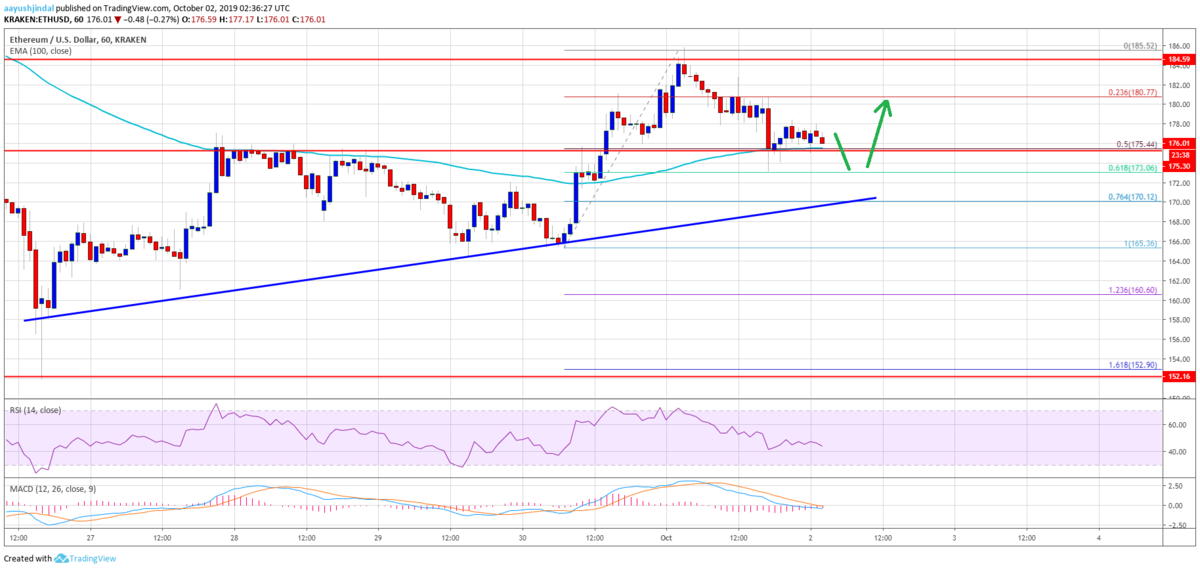
At the moment, the price is trading near the $175 support area and the 100 hourly SMA. More importantly, the 50% Fib retracement level of the last wave from the $165 low to $185 high is providing support near $175.
現在は175ドルのサポートエリアと100時間SMA(単純移動平均線)付近で取引されています。さらに重要なのは、最近の波(165ドル〜185ドル)の50% Fibリトレースメントレベルが175ドル付近でサポートになっていることです。
If there are more downsides, the next key support is near the $172 level. An intermediate support is near the 61.8% Fib retracement level of the last wave from the $165 low to $185 high. Finally, there is a new connecting bullish trend line forming with support near $171 on the hourly chart of ETH/USD. Therefore, Ethereum remains well supported above the $170 level in the near term.
もしさらに下落すれば、次の重要なサポートは172ドル付近になります。中間のサポートは最近の波(165ドル〜185ドル)の61.8% Fibリトレースメントレベル付近です。また、ETH/USDの時間足チャートには、171ドル付近でサポートとなる新しい上昇トレンドラインが形成されています。そのため、短期的には170ドル以上でしっかりとサポートされています。

On the upside, the $185 level is a strong resistance. Once there is a close above the $185 level, the price is likely to accelerate higher towards the $195 and $200 resistance levels in the near term. Conversely, a close below the $170 level might push the price back towards the $165 level.
上昇時は185ドル付近が強力なレジスタンスになります。185ドル以上で引けると、価格は近いうちに195ドルと200ドルのレジスタンスに向けて上昇を加速するでしょう。逆に、170ドル以下で引けると、165ドル台に向けて下落する可能性があります。
via: Ethereum (ETH) Price Likely Preparing For Corrective Move To $200
_


