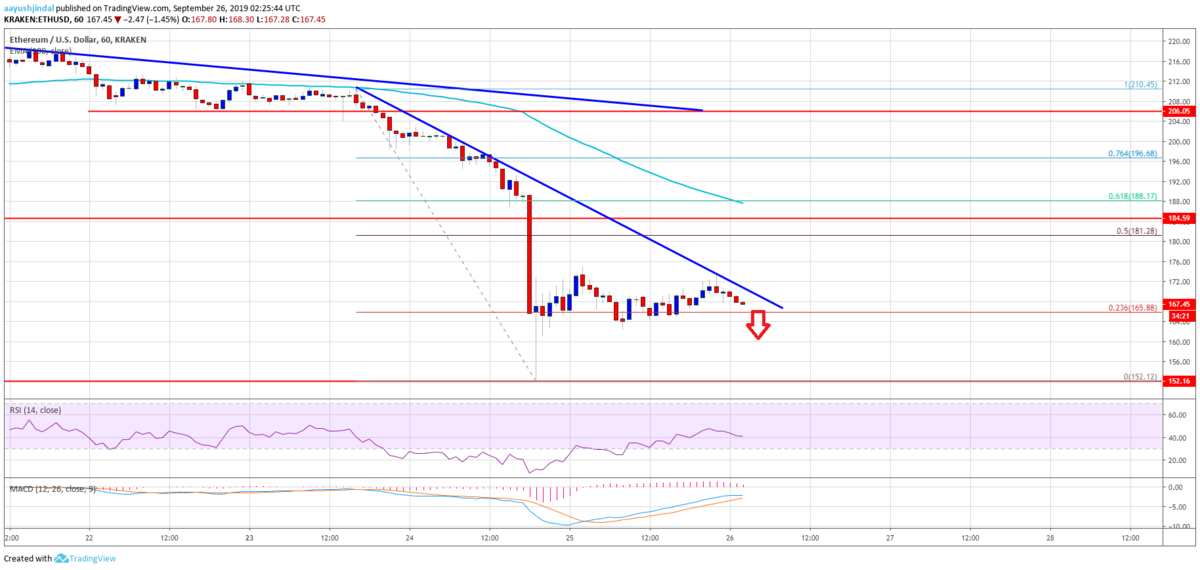
昨日170ドル付近を推移していたイーサリアムは、深夜0時頃に150ドル台まで下洛しました。
その後は少し反発したものの、現在は165ドル付近で取引されています。

Ethereum (ETH) Looks Poised To Resume Its Decline

ここから上昇を始めるには超えるべきハードルが多く、さらに下落を続ける可能性もありそうです。
イーサリアムのチャート分析
On the upside, there is a strong resistance forming near the $170 level. There is also a new connecting bearish trend line forming with resistance near $168 on the hourly chart of ETH/USD.
上側には、170ドル付近に強いレジスタンスが形成されています。また、ETH/USDの時間足チャートには、168ドル付近でレジスタンスとなる新しい下降トレンドラインが形成されています。

The trend line is close to the 76.4% Fib retracement level of the recent decline from the $174 swing high to $152 swing low. Therefore, an upside break above the $168 resistance might push the price higher.
このトレンドラインは最近の下落(174ドル〜152ドル)の76.4% Fibリトレースメントレベル付近にあります。そのため、168ドルのレジスタンスを突破すれば、上昇に転じる可能性があります。
If the price fails to climb above $168 or $170, it is likely to resume its decline. An immediate support is near the $162 and $160 levels. If there is a successful break below the $160 level, the price could revisit the $152 support area in the near term.
価格が168ドルあるいは170ドルを超えられなければ、再び下落に転じる可能性が高くなります。直近のサポートは162ドルと160ドル付近。160ドルを下抜けると、近いうちに152ドルのサポートエリアに戻る可能性があります。
Looking at the chart, Ethereum price is showing a lot of bearish signs below the $170 level. To start a solid upward move, the price must surpass many hurdles such as $168, $170, $172 and $175. If not, it is likely to continue lower towards $150.
チャートを見ると、イーサリアムの価格は170ドルレベル以下で多くの弱気サインを示しています。堅調な上昇を始めるには、168ドル、170ドル、172ドル、175ドルといった多くのハードルを越える必要があります。それらを越えられなければ、150ドルに向けて下落を続ける可能性が高いでしょう。
via: Ethereum (ETH) Price Showing Signs of Further Weakness
_


