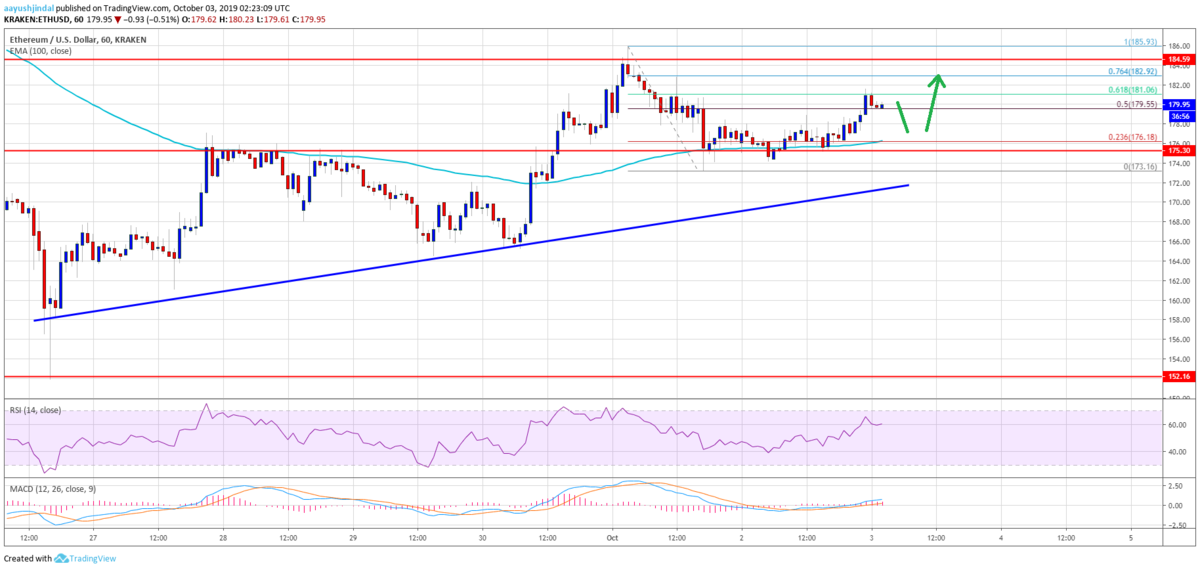
昨日のイーサリアムは時間足チャートの100SMA(単純移動平均線)を下抜け170ドル付近まで下落しました。
しかし、上昇トレンドラインにサポートされ少し反発しています。

Ethereum (ETH) Price Above $185 Would Make Case For Larger Rally

三角保ち合いも形成されつつあり、このまま小さな値幅で推移するのでしょうか。
NEWS BTCでイーサリアムのチャート分析を見てみます。
イーサリアムのチャート分析
The price broke the 23.6% Fib retracement level of the recent drop from the $182 high to $170 low. However, the previous support near the $175 level and the 100 hourly SMA is currently acting as a resistance.
価格は最近の下落(182ドル〜170)の23.6% Fibリトレースメントレベルを突破しました。しかし、以前のサポートだった175ドルと100時間SMA付近が今はレジスタンとして機能しています。
More importantly, there is a major contracting triangle forming with support near $170 on the hourly chart of ETH/USD.
さらに重要なのは、ETH/USDの時間足チャートには170ドル付近でサポートとなる大きな三角保ち合いが形成されています。

If there is a downside break below the $170 support, the price could continue to decline. The next key support is near $165, below which the price is likely to test $160. Conversely, an upside break above $182 and $185 is needed for bullish acceleration.
170ドルのサポートを下抜けると下落が継続する可能性があります。次の重要なサポートは165ドル付近、これを下抜けると160ドルを試す可能性が高くなります。逆に、上昇を加速するには182ドルと185ドルを上抜ける必要があります。
Looking at the chart, Ethereum price is clearly preparing for the next move either above $185 or below $170. As long as the price is below the $175 pivot level and the 100 hourly SMA, there is a risk of a downside break.
チャートを見ると、イーサリアムの価格は明らかに次の動き、つまり185ドルを超えるか170ドルを下回るかのどちらかに備えています。価格が175ドルのピボットレベルと100時間SMA以下である限り、下抜ける恐れがあります。
via: Ethereum (ETH) Price Holding Key Support But For How Long?
_


