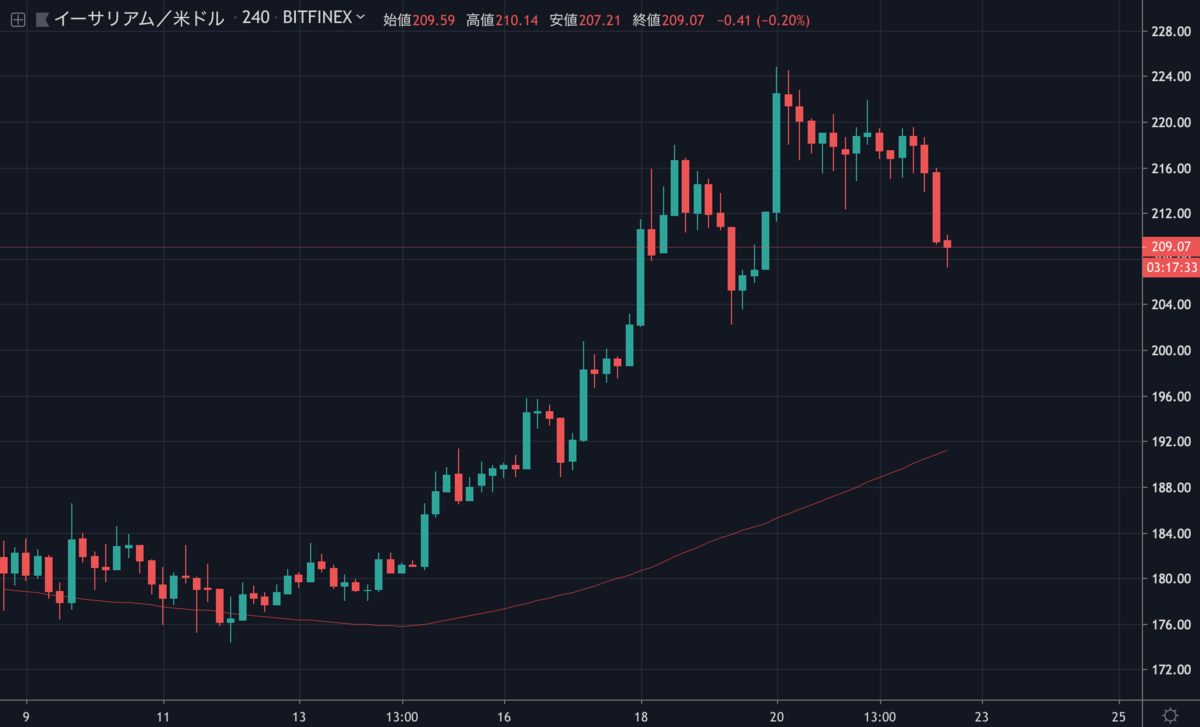
この一週間はビットコインが停滞していたのに対し、イーサリアムは順調に上昇を続けました。
現在は少し価格を戻して209ドル付近で取引されています。

しばらく続いた上昇トレンドはここで終わりなのでしょうか。
NEWS BTCでイーサリアムのチャート分析を見てみます。
イーサリアムのチャート分析
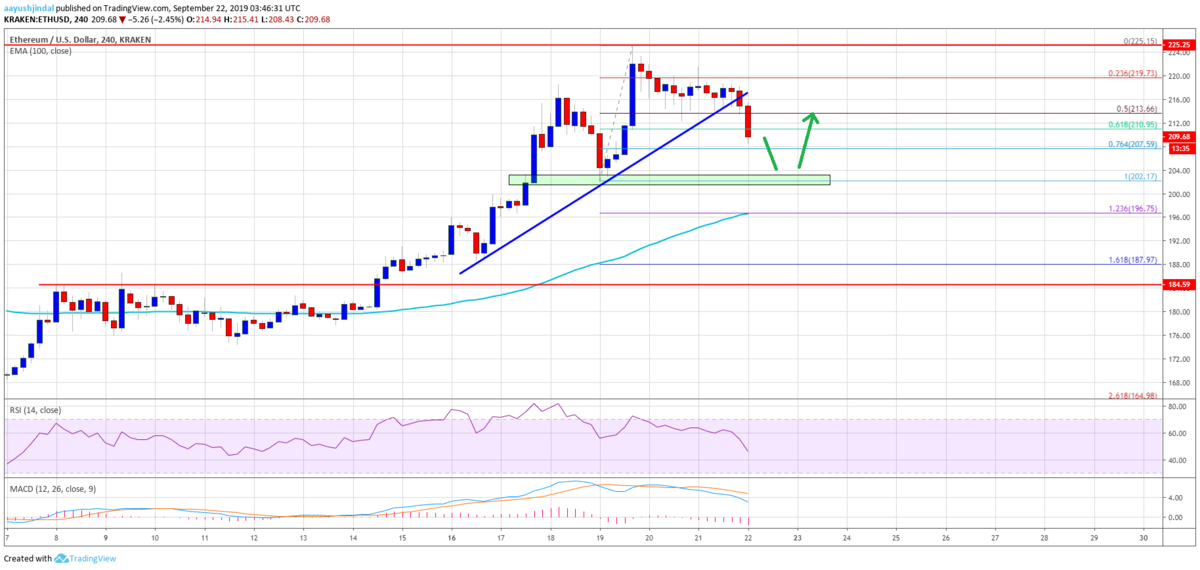
The pair is now trading well below the $210 level. An immediate support is near the $208 level. It coincides with the 76.4% Fib retracement level of the last major upward move from the $202 low to $225 high. However, the main support on the downside for Ethereum is near the $202 and $200 levels. If there is a downside break below the $202 level, the price could continue to decline towards the $185 support.
ETH/USDペアは現在210ドル以下で取引されています。直近のサポートは208ドル付近で、これは最近の大きな上昇(202〜225ドル)の76.4% Fibリトレースメントレベルと一致します。しかし、下落時の主なサポートは202ドルと200ドル付近。202ドルを下抜けた場合は、価格は185ドルに向けて下落を続けるでしょう。

On the upside, an immediate resistance is near the $215 level. If there is an upside break above the $215 level, the price could revisit the $225 high. Any further gains might push the price towards the $240 level.
上昇時の直近のレジスタンスは215ドル付近。215ドルを上抜ければ、価格は225ドルの高値に再び届くでしょう。さらに上昇すれば240ドルに向けて押し上げられる可能性があります。
The above chart indicates that Ethereum price is currently correcting gains from the $225 high. However it is likely to find strong bids near $202 and $200. Once the current correction is complete near $200, the price could bounce back.
上のチャートは、現在イーサリアムの価格が225ドルの高値から調整していることを示しています。しかし、202ドルと200ドル付近で強い買いが入りそうです。現在の調整が200ドル付近で完了すれば、価格が反発する可能性があります。
via: Ethereum Price Weekly Forecast: ETH Sighting Fresh Increase
_


