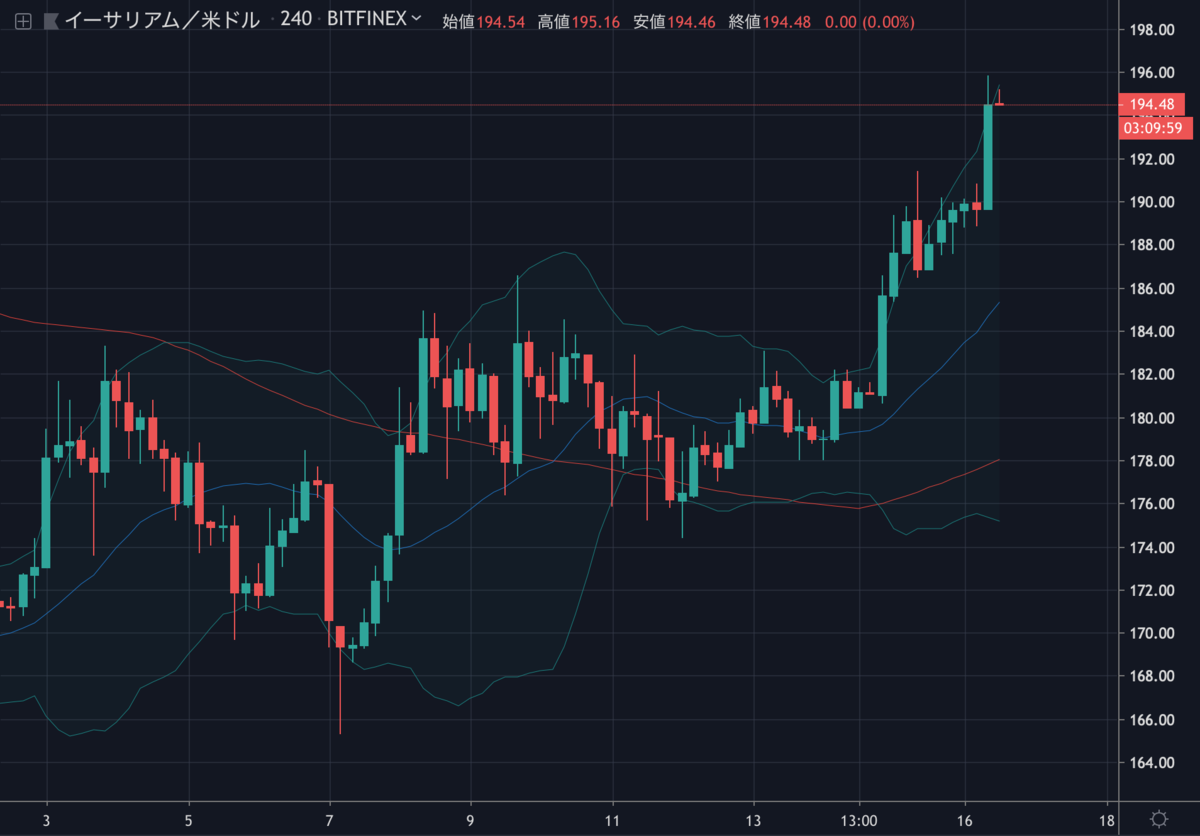
ビットコインは現在も三角保ち合いを継続していますが、一方でイーサリアム(ETH)はここ数日間上昇しています。
投資家の資金がBTCからETHに流れているのでしょうか?

イーサリアムの今後の値動きはどのように予想されるのでしょうか。
NEWS BTCでイーサリアムのチャート分析を見てみます。
イーサリアムのチャート分析
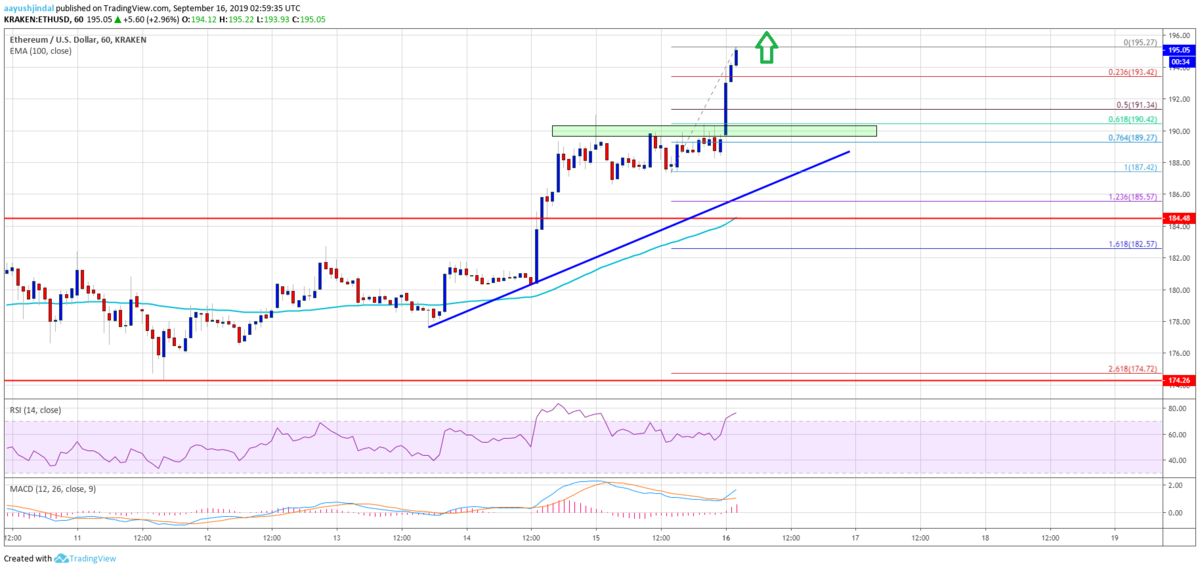
Ethereum price even broke the $192 level and traded to a new weekly high at $195. The current price action indicates more gains above the $195 level.
イーサリアムの価格は192ドルをも突破し、一週間の最高値を更新して195ドルで取引されました。現在の値動きは、195ドルを突破する上昇を示唆しています。

If there is a downside correction, an initial support is near the $193 level. It coincides with the 23.6% Fib retracement level of the recent upward move from the $187 swing low to $195 high.
もし下方修正があれば、最初のサポートは193ドル付近になります。これは、最近の上昇(187ドル〜195ドル)の23.6% Fibリトレースメントレベルと一致します。
On the upside, a convincing break above the $195 level could open the doors for a push towards the $200 resistance level. However, the main resistance is near the $205 level (the previous support), above which the price could surge towards $220.
上昇する場合は、195ドルをはっきり上抜けることで200ドルのレジスタンスレベルに向けて上昇する可能性が生まれます。しかし、主なレジスタンスは205ドル付近(前回のサポート)、これを超えると220ドルまで上昇する可能性があります。
Looking at the chart, Ethereum price is trading with a strong bullish bias above the $190 level. If the price remains above the $190 level for a couple of sessions, there are high chances of a run towards the $200 and $205 levels. If not, the price may perhaps extend the correction towards $188 or $185.
チャートを見ると、イーサリアムの価格は190ドルレベルを上回り強力な強気バイアスで取引されています。価格が190ドル以上をしばらく維持できれば、200ドルと205ドルに向けて上昇する可能性が高くなります。維持できない場合は、おそらく188ドルまたは185ドルまで調整すると思われます。
via: Ethereum Price (ETH) Surging While Bitcoin Trading Sideways
_


