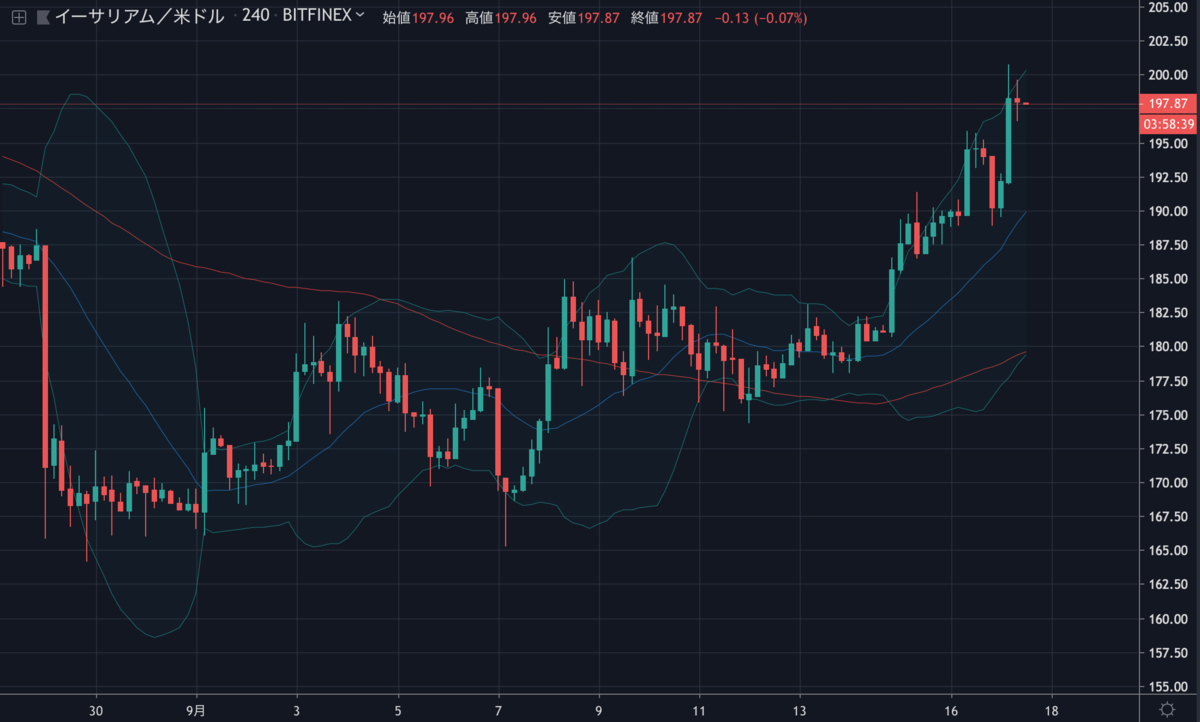
ビットコインの値動きがパッとしない一方で、イーサリアムは引き続き上昇を続け、一時は200ドルを突破しました。現在は少し価格を戻して198ドル付近で取引されています。

イーサリアムの価格はこのまま200ドルを突破し、さらに上をめざすのでしょうか。
NEWS BTCでイーサリアムのチャート分析を見てみます。
イーサリアムのチャート分析
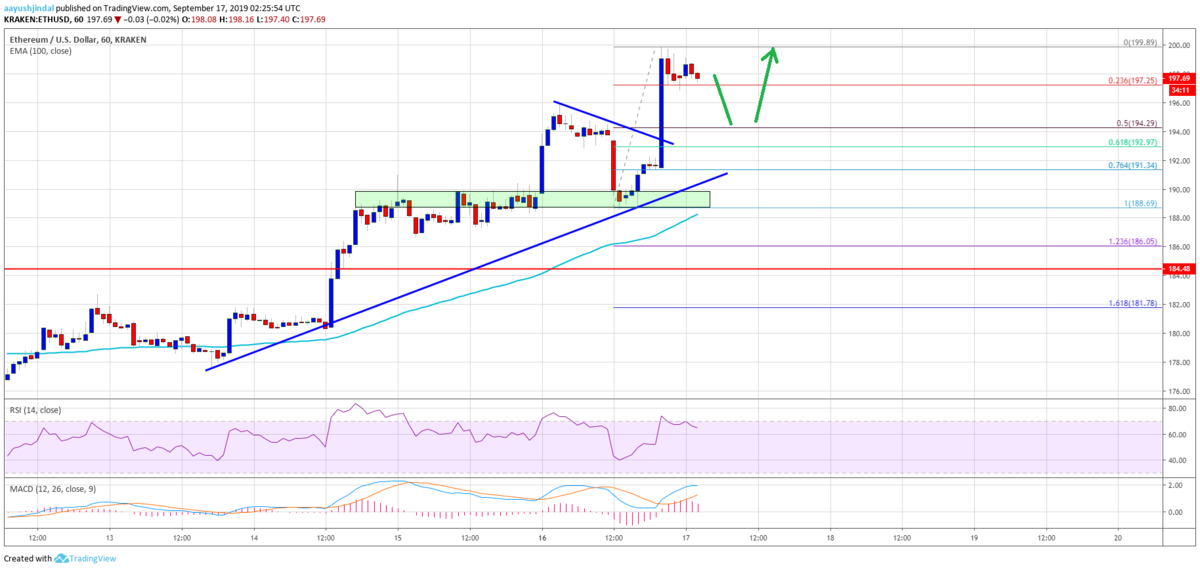
An immediate support is near the $197 level. It coincides with the 23.6% Fib retracement level of the last leg from the $189 swing low to $200 high. If there is an extended downside correction, the price could test the $195 support area.
直近のサポートは197ドル付近。これは最近の足(189ドル〜200ドル)の23.6% Fibリトレースメントレベルと一致します。もし下方修正が長引けば、価格は195ドルのサポートを試す可能性があります。
More importantly, yesterday’s highlighted major bullish trend line is active with support near $193 on the hourly chart of ETH/USD. The main support for Ethereum is near the $185 level (the previous resistance). Therefore, dips remain well supported in the near term towards $195 and $193. On the upside, an immediate resistance is near the $200 handle.
さらに重要なのは、昨日注目した大きな上昇トレンドラインが機能しており、ETH/USDの時間足チャートの193ドル付近でサポートしていることです。主なサポートは185ドル付近(以前のレジスタンス)になります。そのため、短期的に195ドルと193ドルがサポートになり、直近のレジスタンスは200ドル付近になります。

If the price breaks the $200 level, there are high chances of it surpassing the $205 resistance level. The next key resistance is near the $210 level, above which the price could surge towards the $220-$225 zone.
価格が200ドルを上抜けると、205ドル付近のレジスタンスを突破する可能性が高くなります。次の重要なレジスタンスは210ドル付近、これを超えると220〜225ドルゾーンに向けて急騰する可能性があります。
Looking at the chart, Ethereum price is clearly outperforming bitcoin and other altcoins. As long as it is trading above the trend line support and $185, there are chances of more gains.
チャートを見ると、イーサリアムの価格は明らかにビットコインや他のアルトコインより高パフォーマンスで上昇しています。トレンドラインのサポートと185ドル以上で取引されている限り、さらなる上昇の可能性があります。
via: Ethereum Price (ETH) Touches $200 While Bitcoin Is Declining
_


