
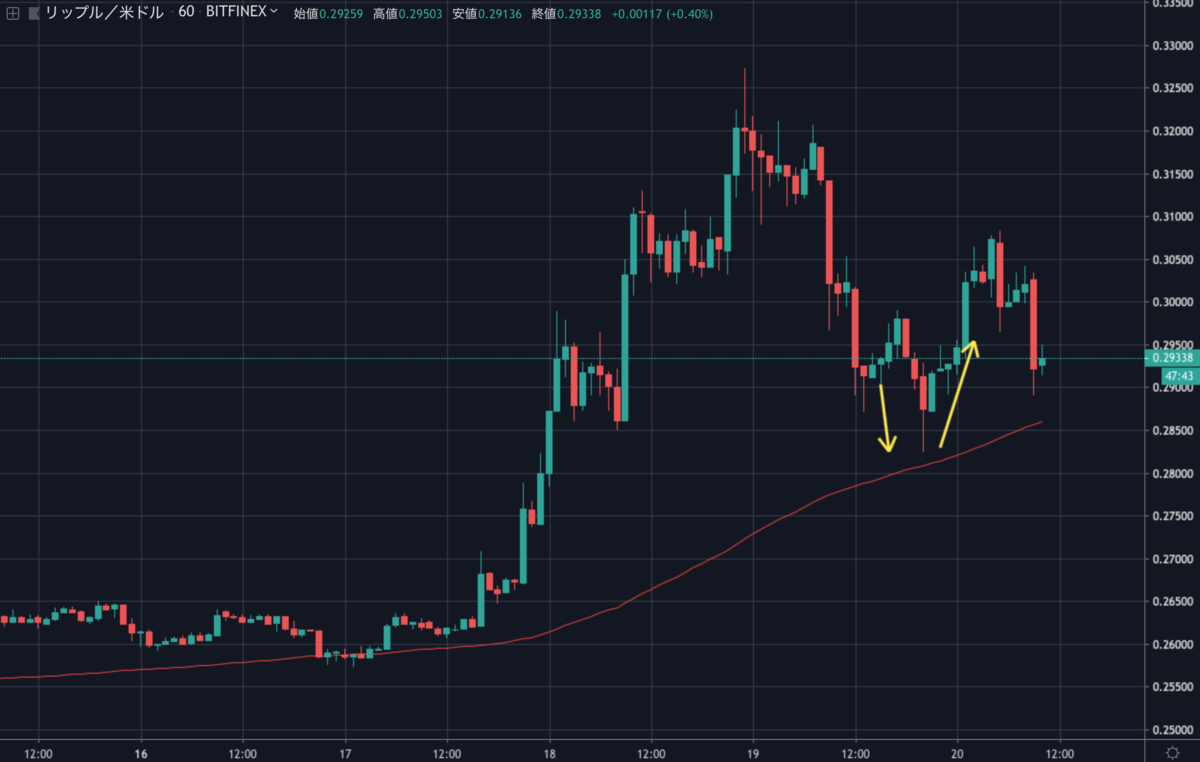
昨日のイーサリアム(ETH)とリップル(XRP)はサポートライン付近で反発し、上昇トレンドを再開しました。
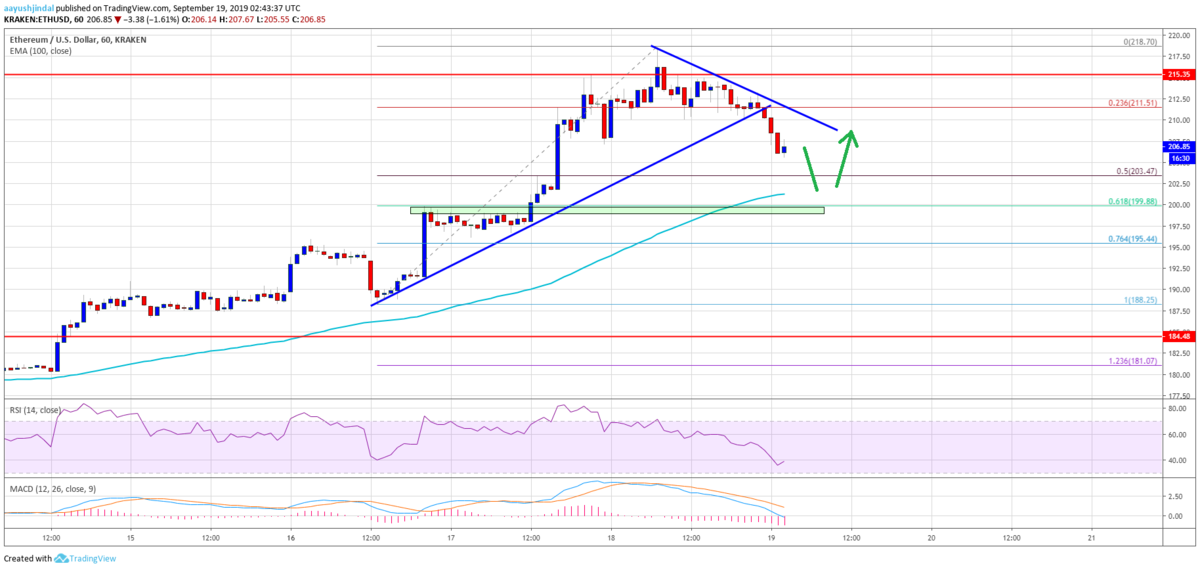
Ethereum (ETH) Price Correcting Gains, Should U Buy Dips?
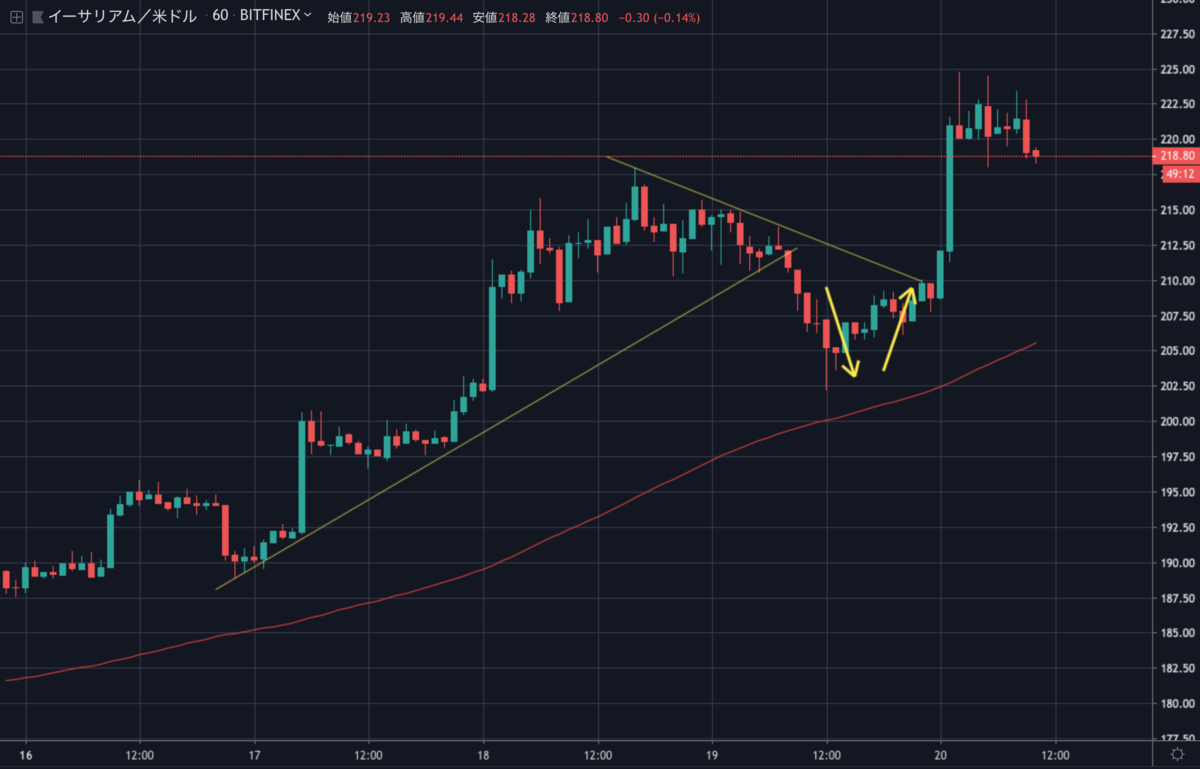
まさに昨日の予想図通りの値動きです。
XRPも良い感じです。
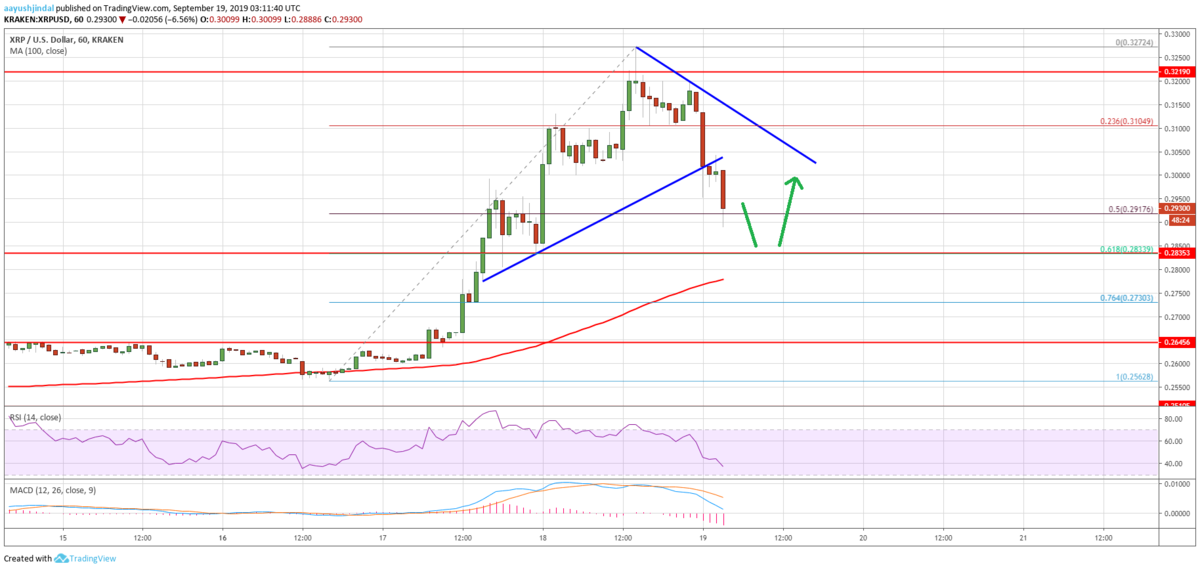
Ripple Price (XRP) Retreating From $0.32 But Approaching Supports
今日もNEWS BTCでイーサリアム(ETH)とリップル(XRP)のチャート分析を見てみます。
イーサリアムのチャート分析
A swing low was formed near $202 and the price started a fresh increase. It surged above the $210 and $215 resistance levels to move back into a positive zone.
202ドルで安値を付け、価格は再び上昇を始めました。210ドルと215ドルのレジスタンスを上抜け、ポジティブゾーンに戻りました。
More importantly, there was a break above a connecting bearish trend line with resistance near $208 on the hourly chart of the ETH/USD pair. It opened the doors for more gains above the $220 level.
さらに重要なのは、ETH/USDペアの時間足チャートで、208ドル付近でレジスタンスとなっていた下降トレンドラインを上抜けたことです。これによりさらに上昇して220ドルを突破する可能性が開けました。
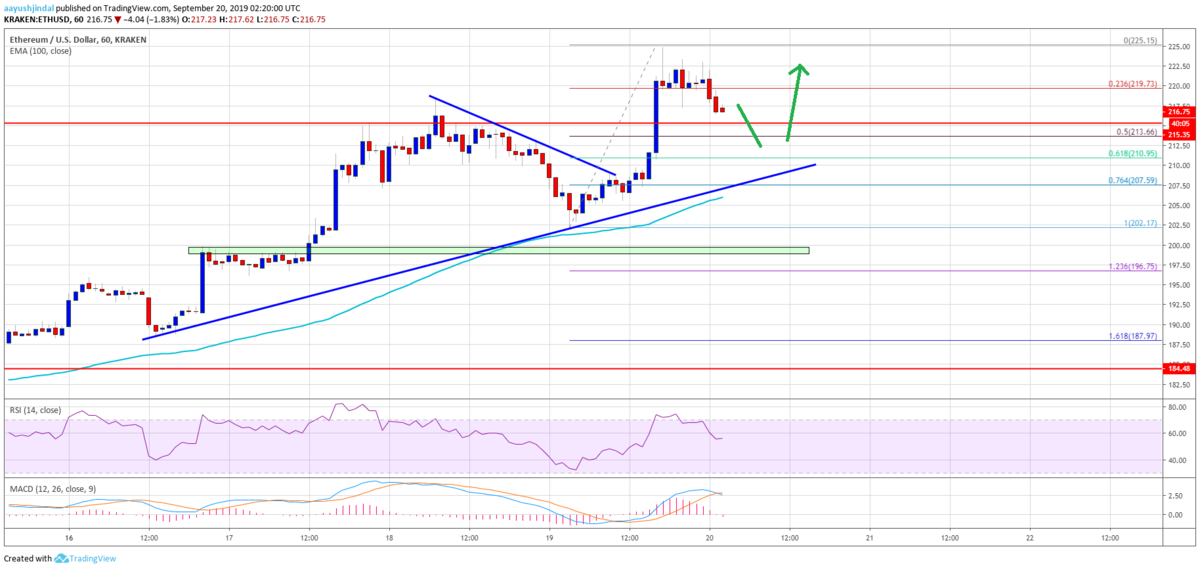
There is also a new major bullish trend line forming with support near $210 on the same chart.
210ドル付近でサポートとなる新しい上昇トレンドラインも形成されています。
Therefore, dips towards the $212 and $210 levels could find a strong buying interest in the near term. On the upside, an immediate resistance is near the $225 level. If there is an upside break above $225, the price could rally further towards the $240 resistance area.
そのため、212ドルと210ドル付近に向けて下落すると、短期的に強い買いが入る可能性があります。上昇時の直近のレジスタンスは225ドル付近。225ドルを上抜けると、240ドルのレジスタンスに向けてさらに上昇する可能性があります。
Looking at the chart, Ethereum price is back in a positive zone above the $210 and $212 levels. As long as there is no close below the $210 support and the 100 hourly SMA, there are chances of another increase towards the $240 level.
チャートを見ると、イーサリアムの価格は210ドルと212ドル以上のポジティブゾーンまで戻っています。210ドルのサポートと100時間SMA以下で引けない限り、240ドルに向けてさらに上昇する可能性があります。
via: Ethereum (ETH) Price Climbs Again, Bulls Likely Sighting $240
リップルのチャート分析
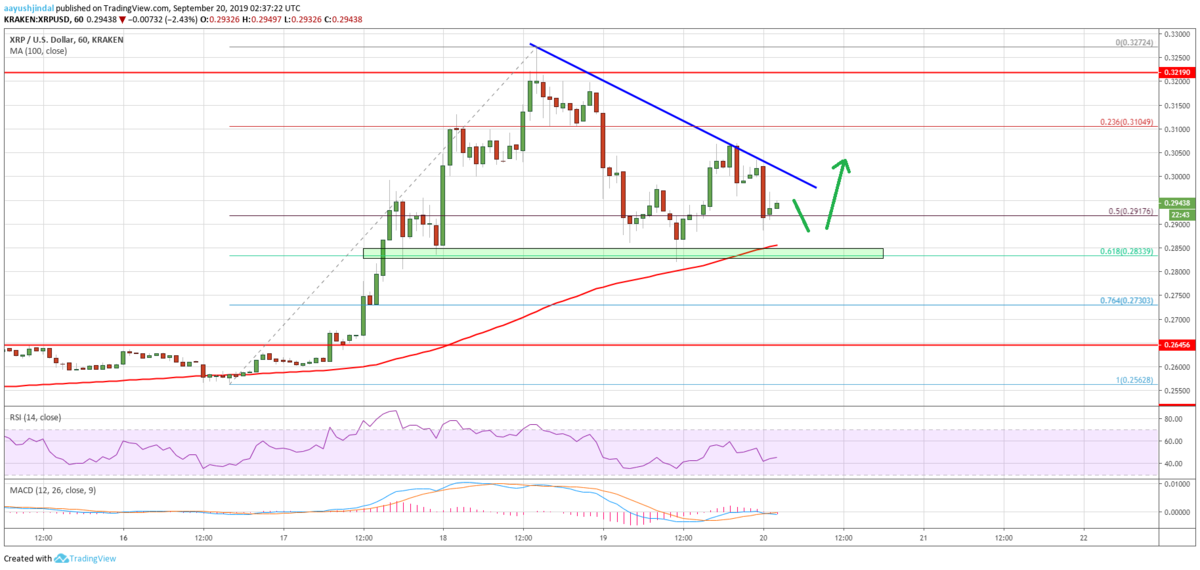
上昇時
- 価格が0.285ドルを上回っている限りさらに上昇する可能性あり
- 0.3ドルと0.305ドル付近に重要なレジスタンスと下降トレンドライン
- 0.305ドルを突破すれば0.325ドルのレジスタンスエリアに向けて上昇する可能性
下落時
- 0.285ドルのサポートを下抜けるとさらに下落する可能性
- 次の重要なサポートは0.272ドルと0.273ドル付近
- 0.272ドル以上を維持できなければ0.265ドルまで戻る可能性
Looking at the chart, ripple price is clearly holding the key $0.2850 support area and the 100 hourly SMA. Therefore, there are high chances of a fresh increase towards $0.3250. Only a close below the 100 hourly SMA might push the price to $0.2720.
チャートを見ると、リップルの価格は明らかに0.285ドルのサポートエリアと100時間SMAを維持しています。そのため、0.325ドルに向けて新たに上昇する可能性が高いでしょう。100時間SMA以下で引けた場合にのみ、0.272ドルまで戻される可能性があります。
via: Ripple Price (XRP) Holding Key Support: BTC & ETH Bounce Back
_


