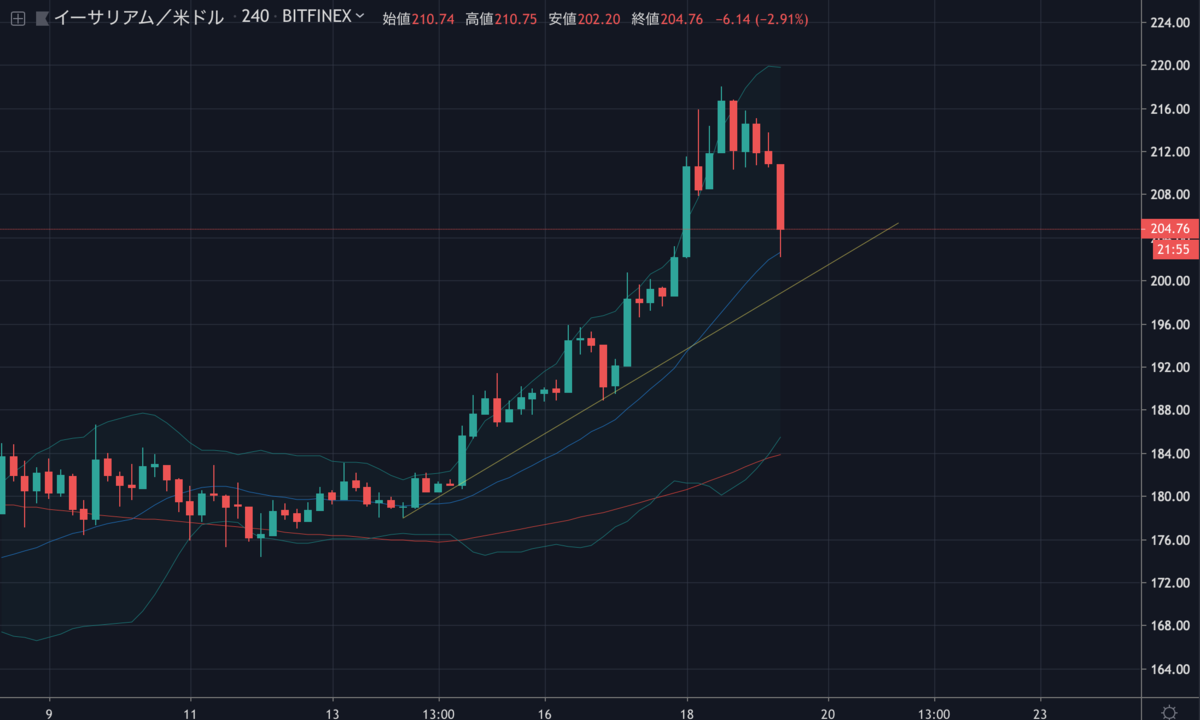
これまで小さな値動きを続けていたビットコインが急落し、数日前から上昇トレンドで取引されていたイーサリアム(ETH)も同様に下落しています。

このまま上昇トレンドは終了してしまうのか、それとも絶好の押し目買いポイントとなるのでしょうか。
NEWS BTCでイーサリアムのチャート分析を見てみます。
イーサリアム(ETH)のチャート分析
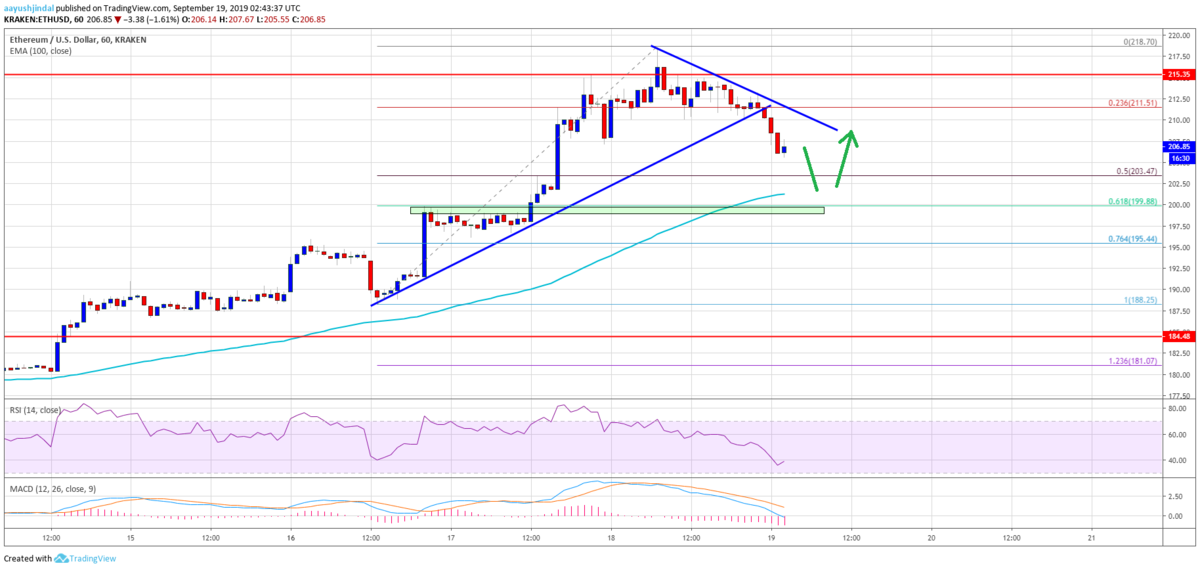
An immediate support on the downside is near the $204 level. It coincides with the 50% Fib retracement level of the upward move from the $188 low to $218 high. However, the main support is near the $200 level and the 100 hourly SMA.
下落時の直近のサポートは204ドル付近。これは、上昇の動き(188ドル〜218ドル)の50% Fibリトレースメントレベルと一致します。しかし、主なサポートは200ドルと100時間SMA(単純移動平均線)付近になります。

Therefore, the price is likely to find support if it corrects lower towards the $204 or $200 levels. On the upside, there is a short term resistance forming near the $210 level and a connecting bearish trend line on the same chart. If there is an upside break above $210, the price could resume its upward move in the near term.
そのため、価格が204ドルまたは200ドルに向けて下方修正された場合は、そこでサポートされる可能性が高いでしょう。上昇する場合は、210ドル付近に短期的なレジスタンスと下降トレンドラインが形成されています。もし 210ドルを上抜ければ、近いうちに上昇に転じる可能性があります。
Looking at the chart, Ethereum price is clearly correcting lower below the $210 support area. It seems like the price might revisit the $200 support area and the 100 hourly SMA. Once the current correction phase is complete, the price could start a solid upward move.
チャートを見ると、イーサリアムの価格は明らかに210ドルのサポートエリアを下抜けています。価格は再び200ドルのサポートエリアと100時間SMAに向かいそうです。現在の調整が完了すれば、価格は着実に上昇し始めるでしょう。
via: Ethereum (ETH) Price Correcting Gains, Should U Buy Dips?
リップル(XRP)のチャート分析
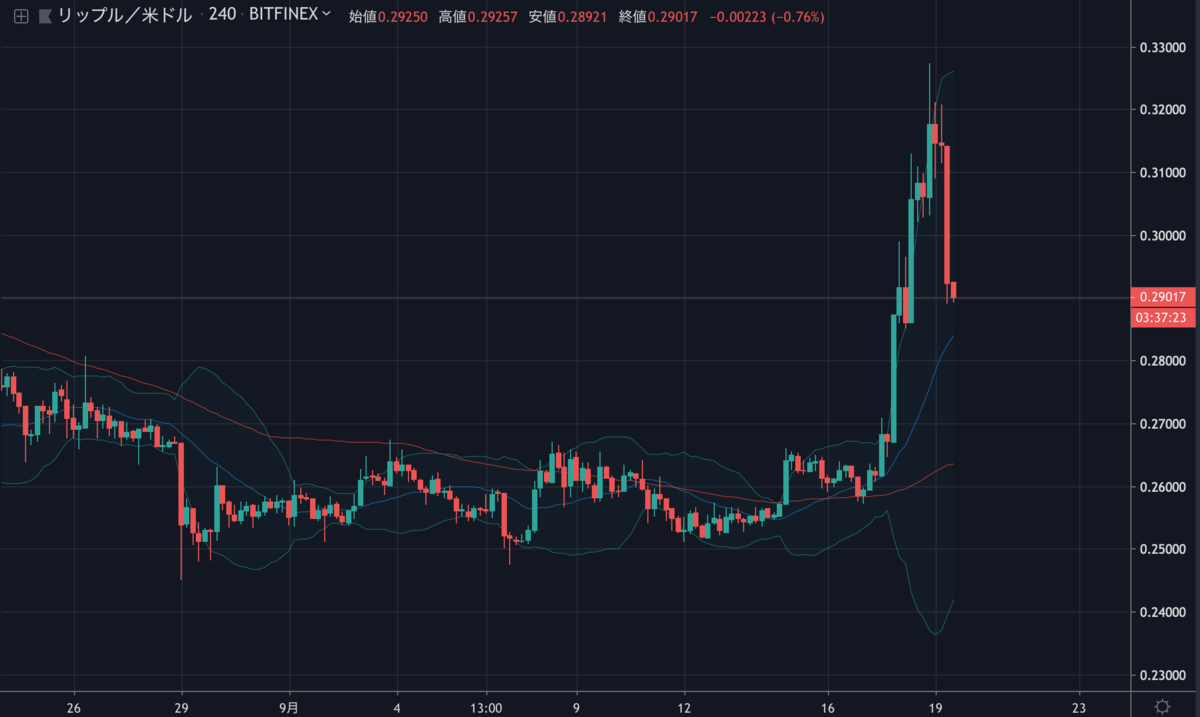
激しく急騰していたXRPも同様に下落しています。
こちらも押し目買いのチャンスになるのでしょうか?


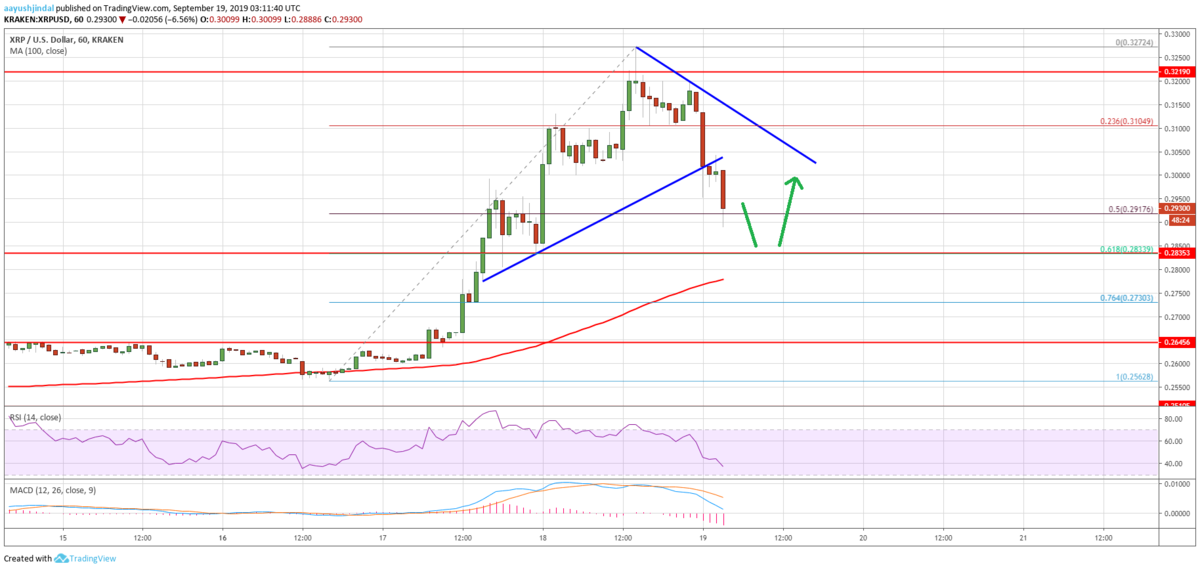
下落時
- 次の重要なサポートは0.285ドルと0.284ドル付近
- それらを下抜けると次の主なサポートは0.265ドル付近
上昇時
- レジスタンスは0.3ドル付近
- 0.305ドルのレジスタンスを上抜けると再び上昇トレンドに戻る可能性
- 次の主なレジスタンスは0.32ドルと0.325ドル付近
via: Ripple Price (XRP) Retreating From $0.32 But Approaching Supports
_


