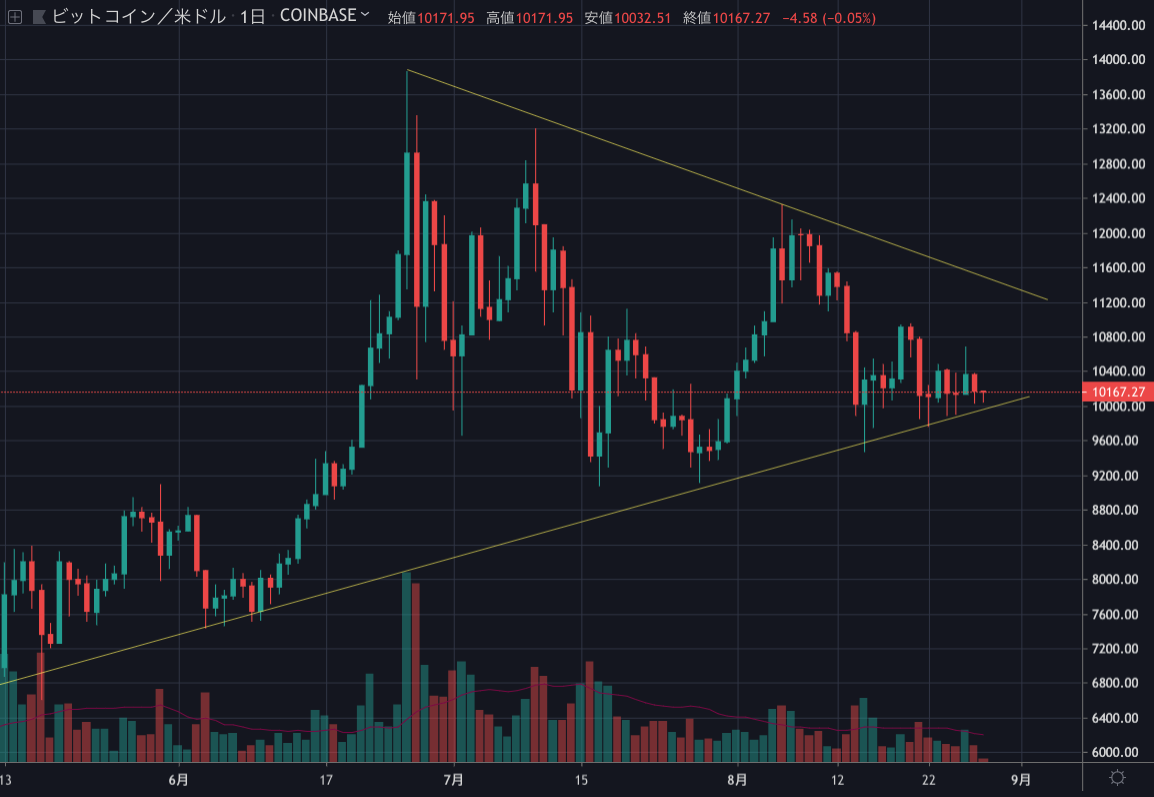
ここ数日のビットコインは小さな値幅でもみ合っており、現在も引き続きレンジ相場を形成しています。
記事執筆時点では10,200ドル付近で推移し、特に大きな動きはまだ見られません。

やはり例年通り夏期は低迷のシーズンなのでしょうか。
NEWS BTCのチャート分析を見てみます。
ビットコインのチャート分析
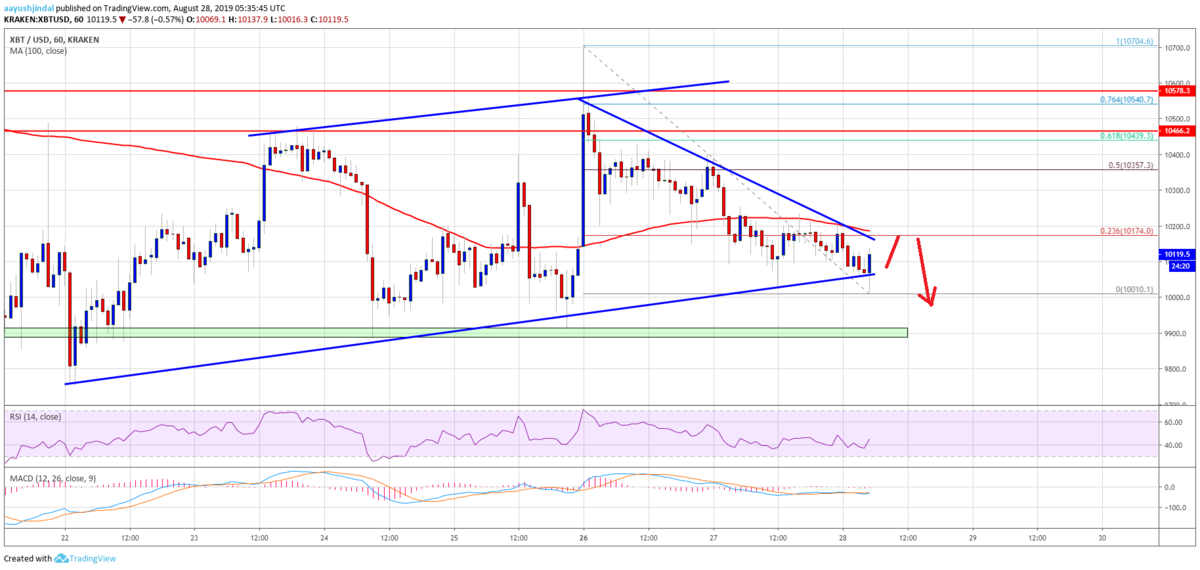
On the upside, an immediate resistance is near the $10,150 level and the 100 hourly simple moving average.
上昇する場合の直近のレジスタンスは10,150ドルと100時間SMA(単純移動平均線)付近になります。

More importantly, yesterday’s highlighted bearish trend line with resistance near $10,170 is intact on the hourly chart of the BTC/USD pair.
さらに重要なのは、BTC/USDペアの時間足チャート上で、昨日強調した10,170ドル付近のレジスタンスを伴う下降トレンドラインがまだ無傷であることです。
Above the trend line and the 100 hourly SMA, the price could recover towards the $10,400 resistance area.
このトレンドラインと100時間SMAを超えると、価格は10,400ドルのレジスタンスエリアに向けて回復するでしょ う。
On the other hand, if there is no upside break above $10,200, the price could continue to move down. The main support on the downside is near the $10,000 level. A successful close below $10,000 might start a strong decline. The next supports are near $9,900 and $9,800, below which the price could test $9,500.
一方、10,200ドルを上抜けることができなければ、下落が継続する可能性があります。下落時の主なサポートは10,000ドル付近。10,000ドル以下で引けると強い下落が始まるでしょう。次のサポートは9,900ドルと9,800ドル、これを下抜けると9,500ドルを試す可能性があります。
Looking at the chart, bitcoin price is following a bearish path below $10,200. Therefore, there are high chances of more losses below the $10,000 support. Only a close above $10,200 and a follow through above $10,350 might decrease the current bearish pressure.
チャートを見ると、ビットコインの価格は10,200ドル以下で下落を続けています。そのため、10,000ドルのサポートを下抜けさらに下落する可能性が高いでしょう。10,200ドル以上で引け、10,350ドルを超えて上昇した場合にのみ、現在の売り圧力を弱める可能性があります。
via: Bitcoin (BTC) Price Recovery Won’t Be Easy Above $10,400
_


